Know the Market's Expected Move with Stolo's Straddle & Strangle Chart
The Straddle & Strangle Chart in Stolo helps traders quickly understand how the options market is pricing volatility and expected movement of an index/stock.
Understand how to use Stolo's Straddle & Strangle Chart
It visually plots combined call and put premiums (from ATM and OTM strikes) to show the implied price range — the area where the market expects the underlying to move until expiry.
With this chart, you can:
- Instantly see breakeven levels and the expected move range.
- Identify volatility expansion or contraction (breakout or range-bound setups).
- Compare ATM straddles and OTM strangles to gauge risk appetite and sentiment.
- Track how the implied range shifts during the day or across expiries.
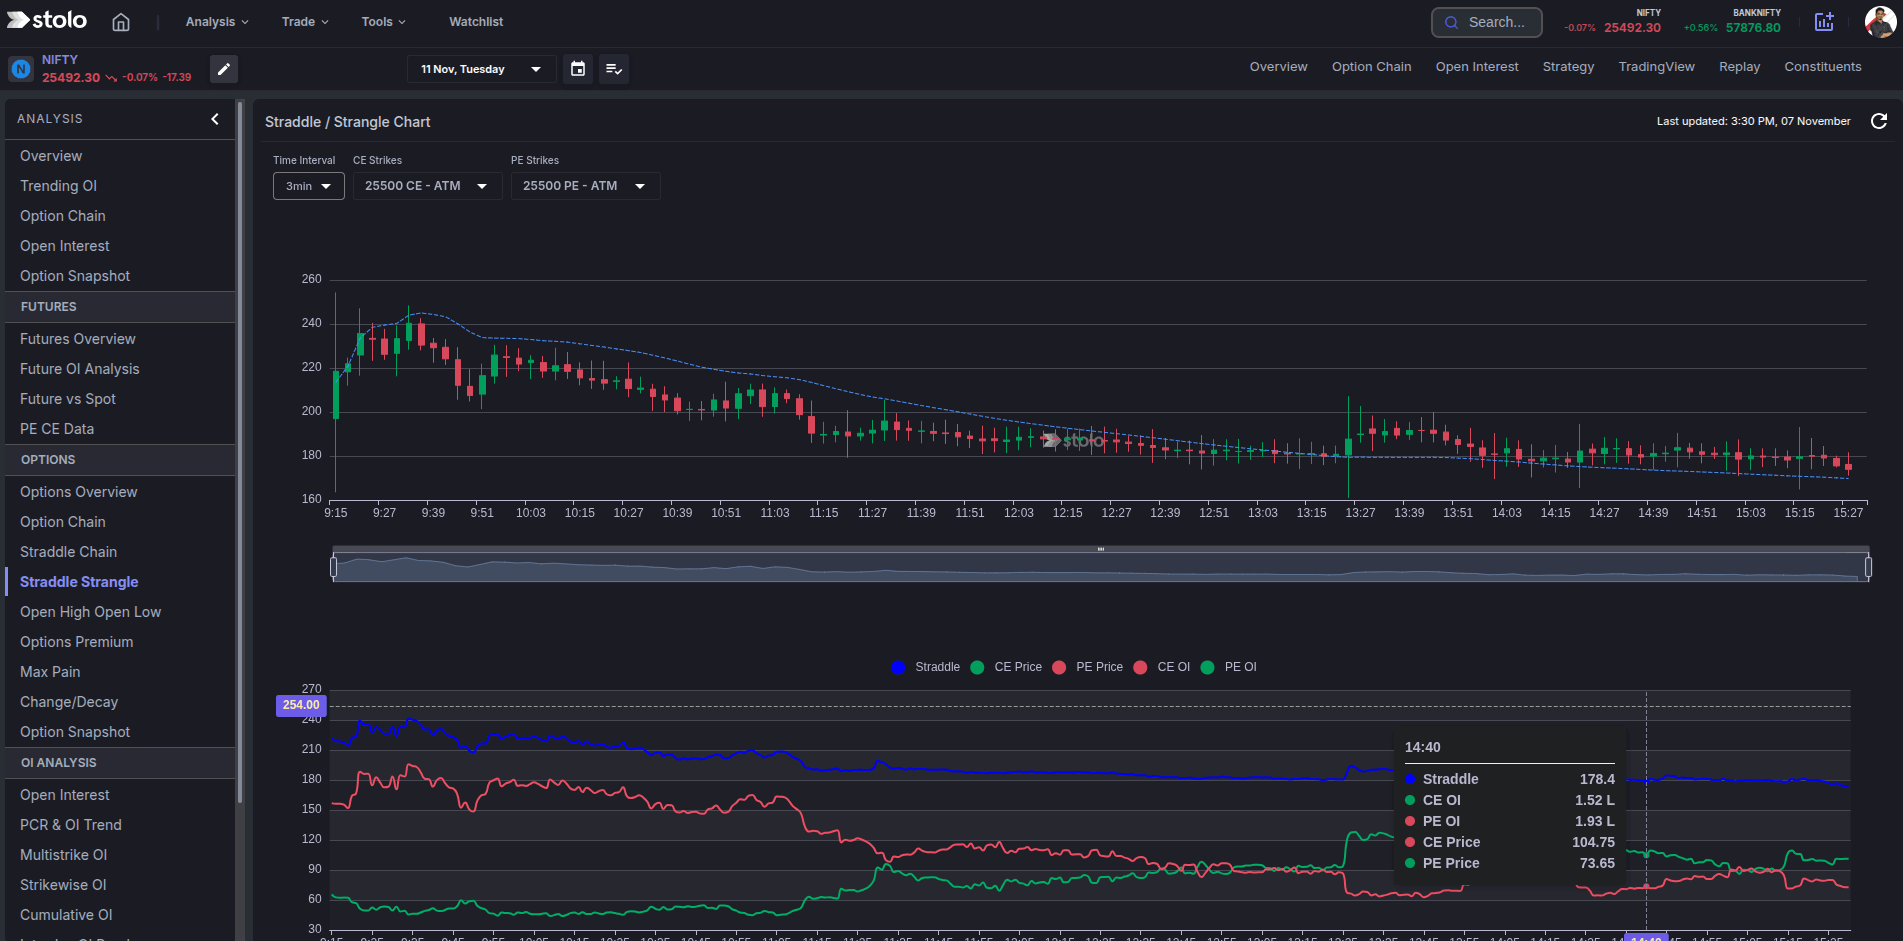
How to use it in Stolo
- Go to Analysis Menu → Options → Click on Straddle/Strangle Chart
- Select your instrument (e.g., NIFTY, BANKNIFTY or a stock of your choice)
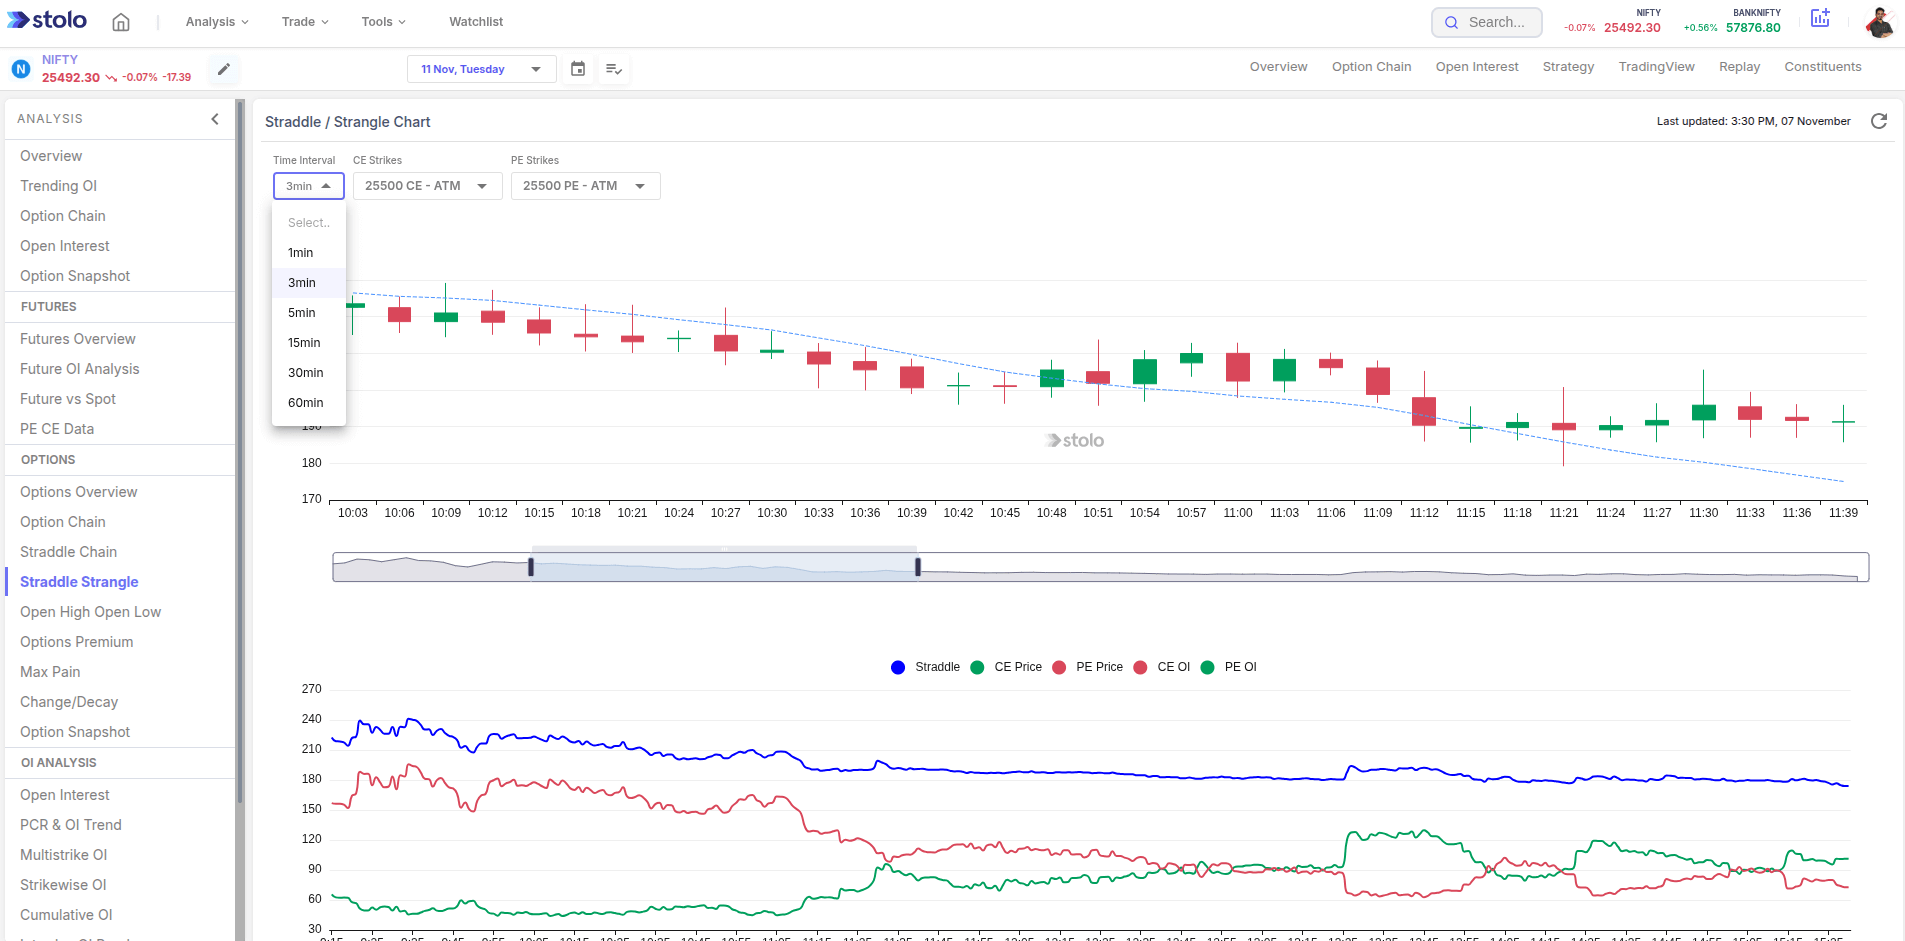
- Pick expiry and timeframe
- The charts would load the straddle/strangle based on the strikes you have chosen
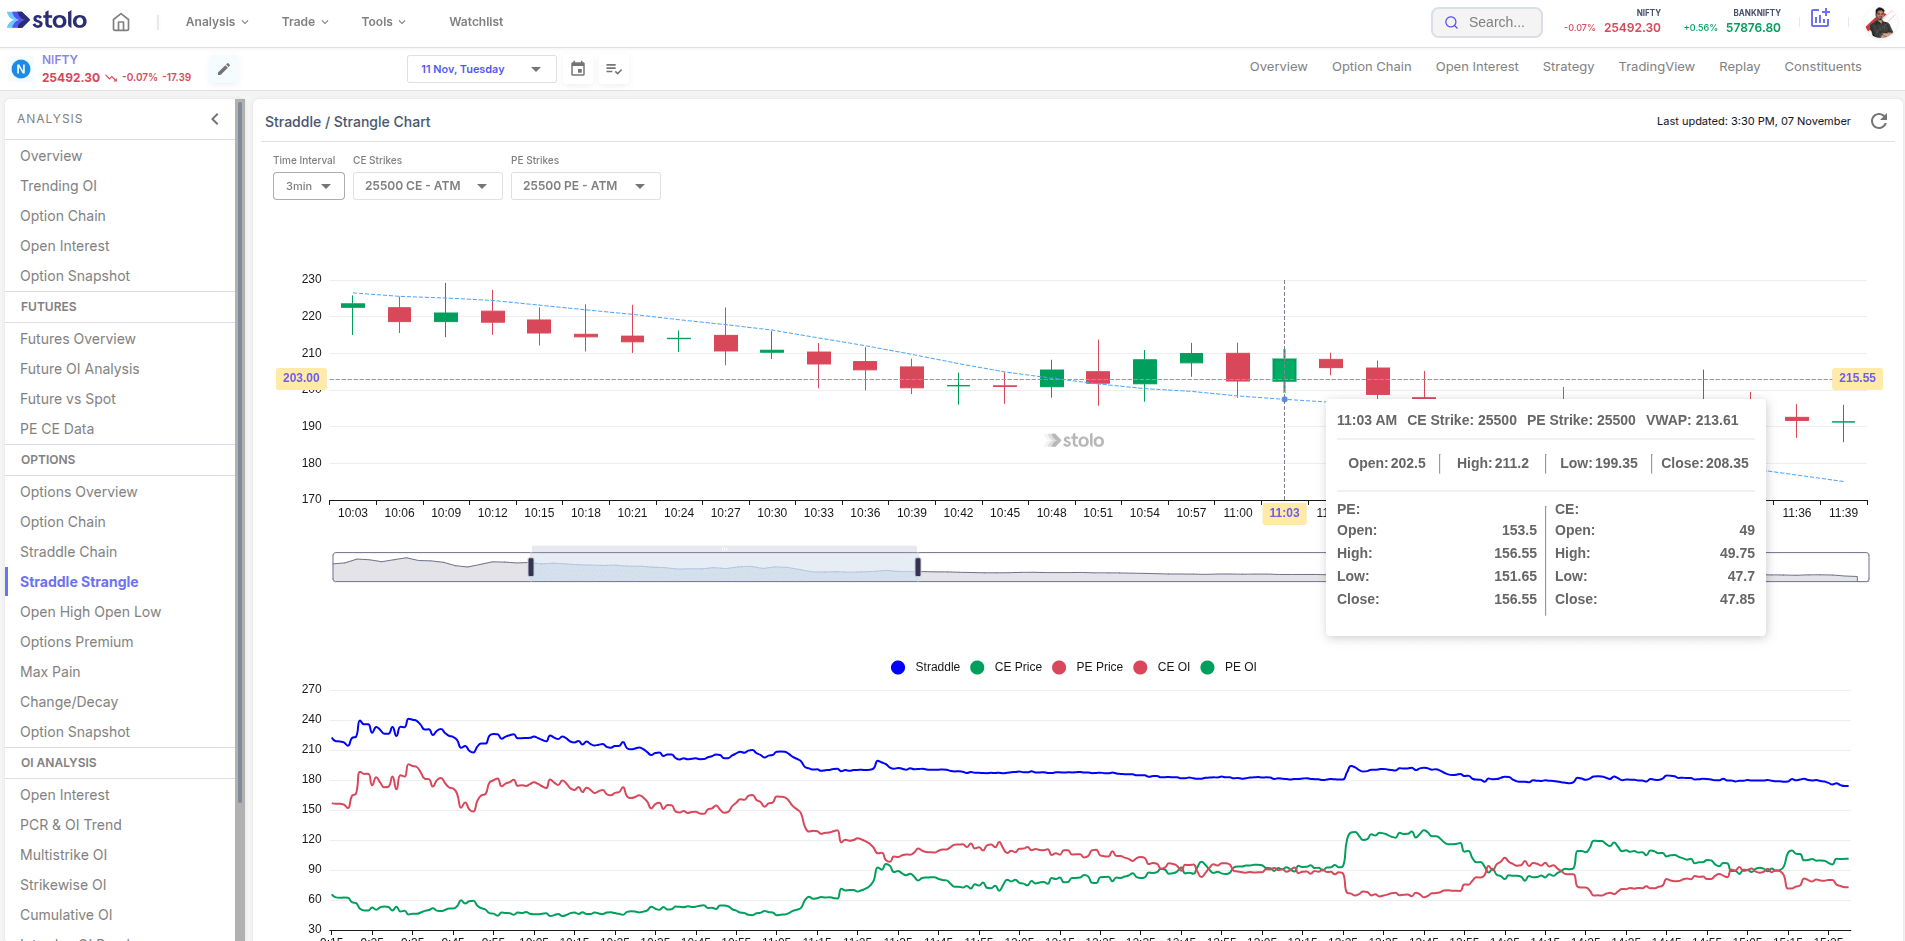
- Hover on chart's bar to see OHLC along with VWAP information
- In addition to it, you would also be able to view PE, CE price, PE and CE OI visually to gauge their impact
- The time scrubber helps you in adjusting the timeline to view graphs in detailed manner
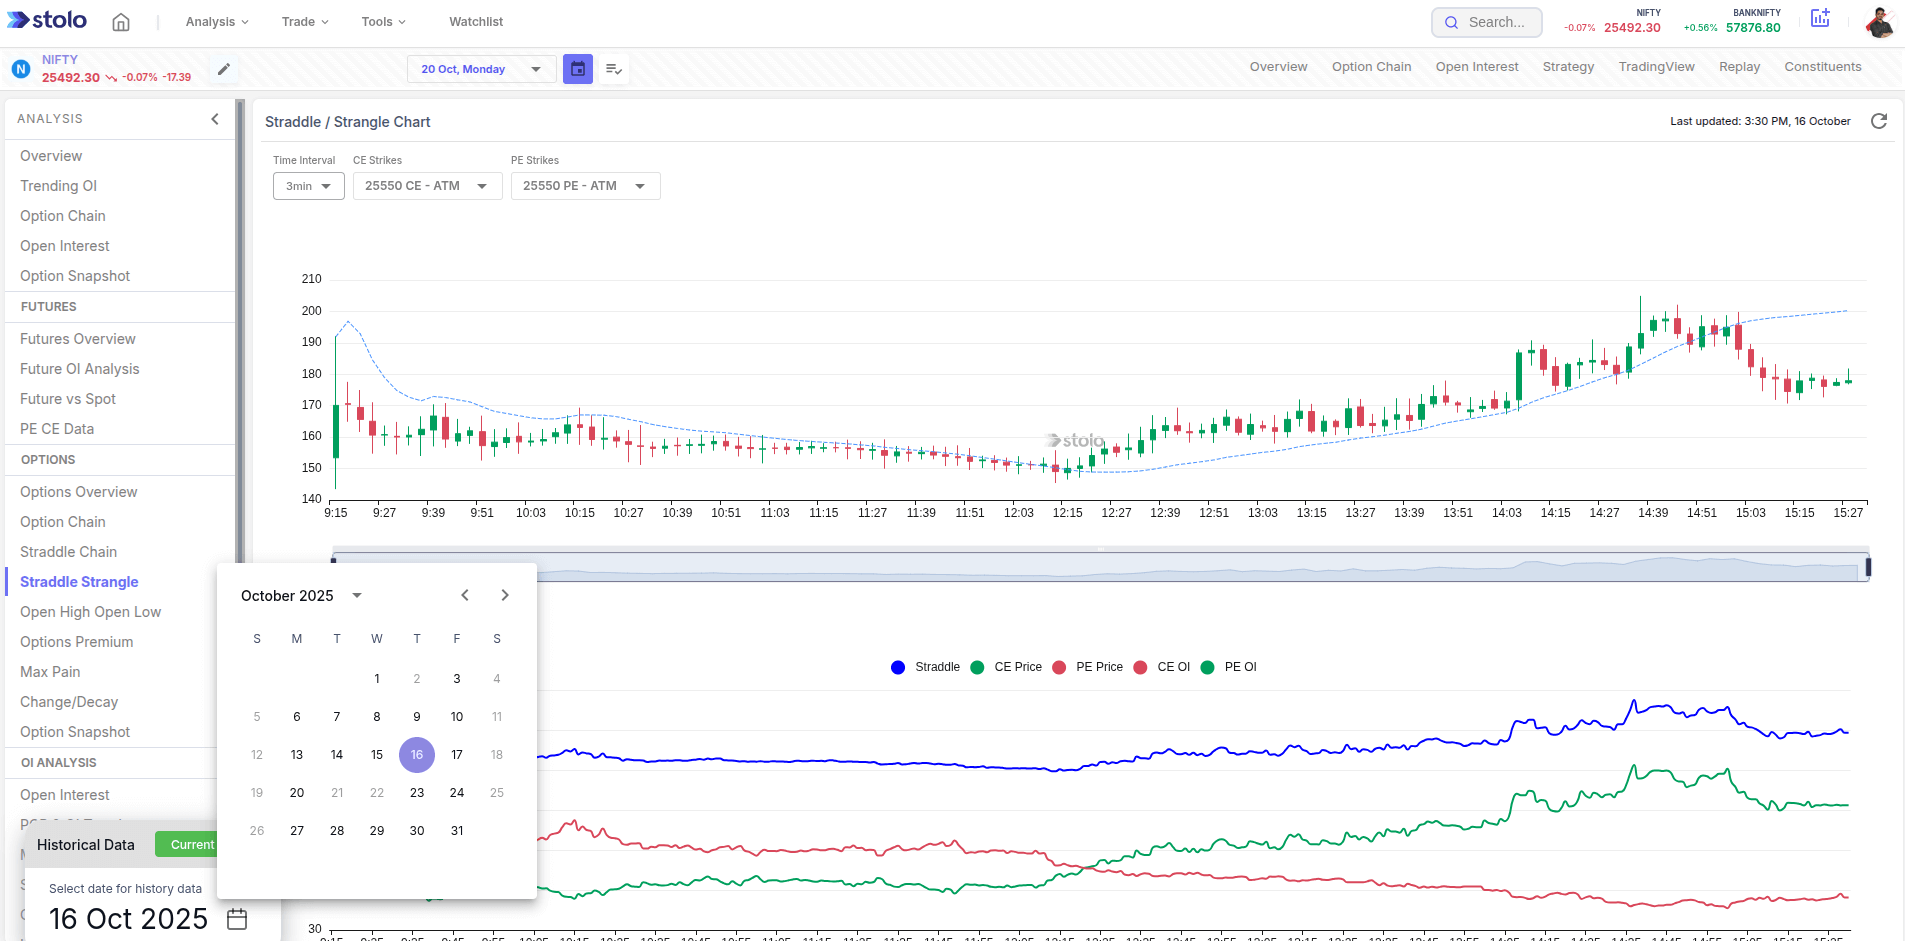
- You can also view historical data by clicking on the calendar icon next to expiry selection

Frequently Asked Questions
What is a Straddle and Strangle?
A Straddle combines buying or selling both a Call and Put at the same strike, while a Strangle uses different strikes (OTM Call and OTM Put). Both reflect market expectations of volatility.
How does the Straddle-Strangle Chart help traders?
It visually shows how option premiums change across strikes, helping traders understand the implied range and volatility sentiment quickly.
Does Stolo plot live data on this chart?
Yes, it updates dynamically using live option prices, giving you real-time range visibility.
Can I compare historical vs current straddle data?
Absolutely — Stolo lets you overlay past session data to study how the expected range has evolved.
Which instruments are supported?
NIFTY, BANKNIFTY, and major F&O stocks are available on Stolo's Straddle-Strangle Chart.
Visualize Straddle & Strangle Data Like Never Before?
Explore Straddle & Strangle chart on your trial plan today, and see how data becomes your trading edge.
Start with Trial Plan at just ₹299