How to Read and Use Open Interest with Stolo
Traders talk about price and volume every day but Open Interest reveals what's brewing beneath the surface. Let's see how to interpret it and how Stolo simplifies this complex data into clear insights.
Open Interest Analysis in Stolo
Challenges Retail Traders Face
Most traders know that Open Interest (OI) is an important part of the options puzzle — but few use it effectively. Why? Because reading OI from traditional broker platforms or option chains is cumbersome and often confusing. You see numbers changing, but you can't tell if traders are building positions, unwinding, or rolling over.
That’s where Stolo bridges the gap, turning raw OI data into intuitive, color-coded insights.
Meet Stolo’s Open Interest, the Smart Way to See Market Sentiment
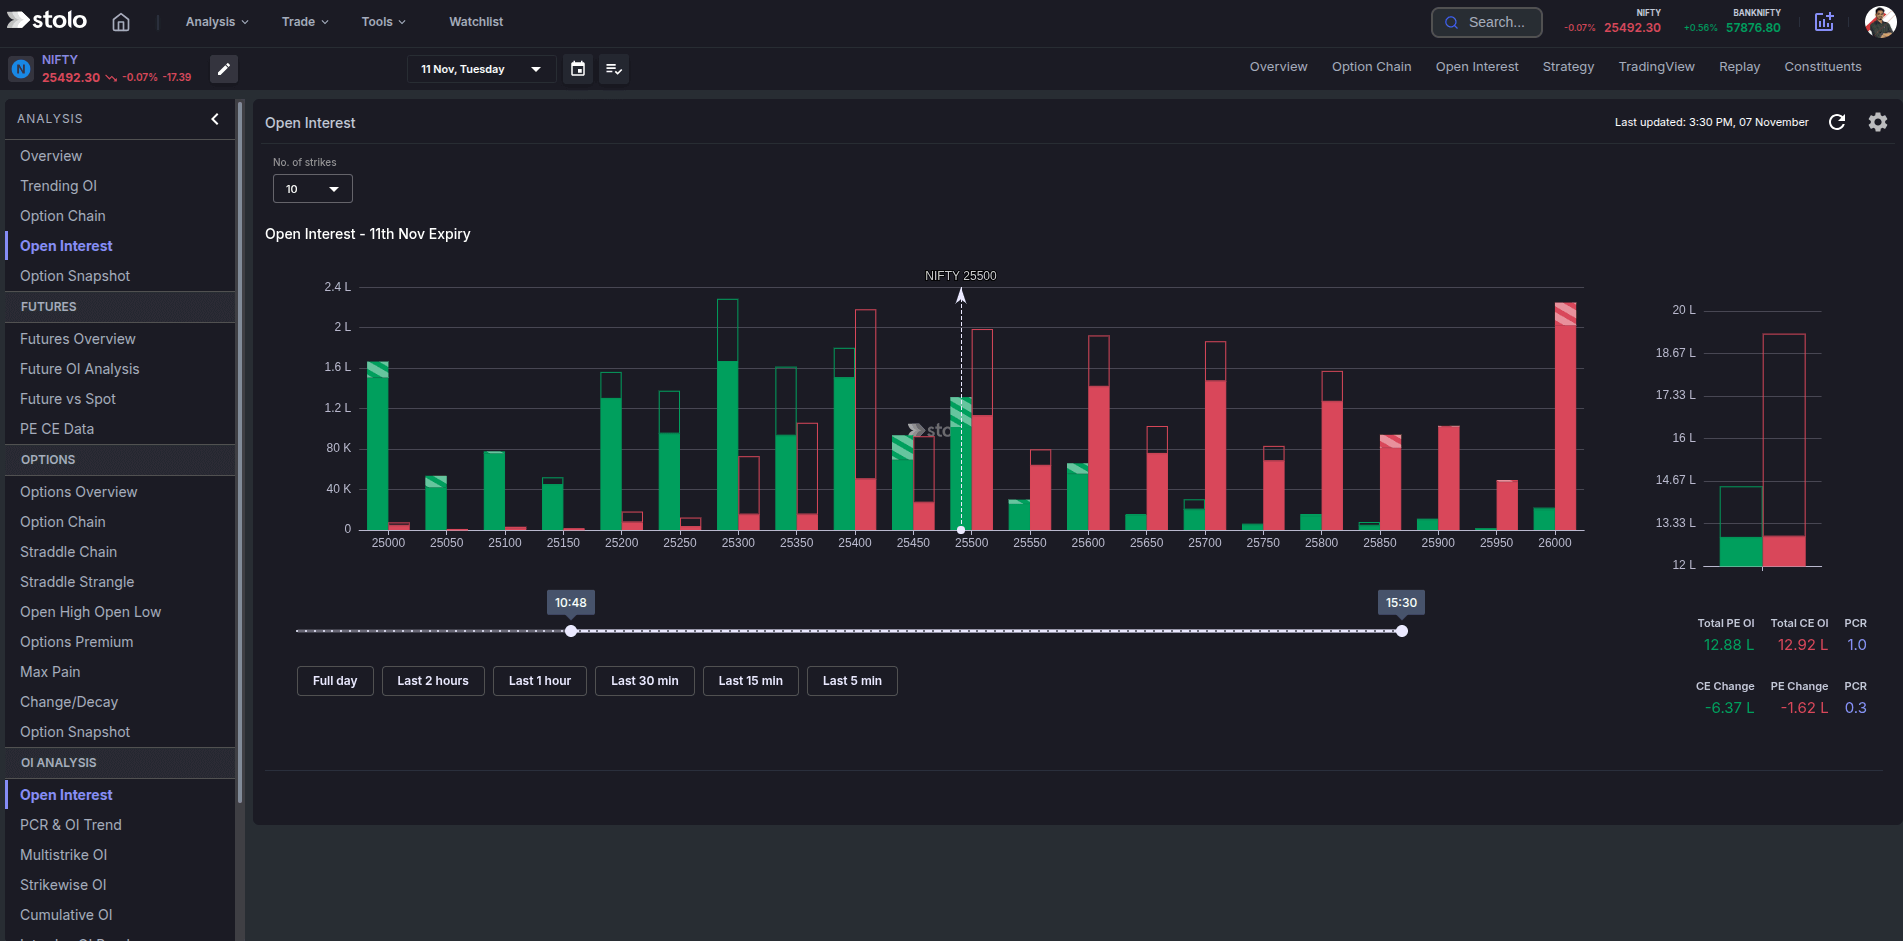
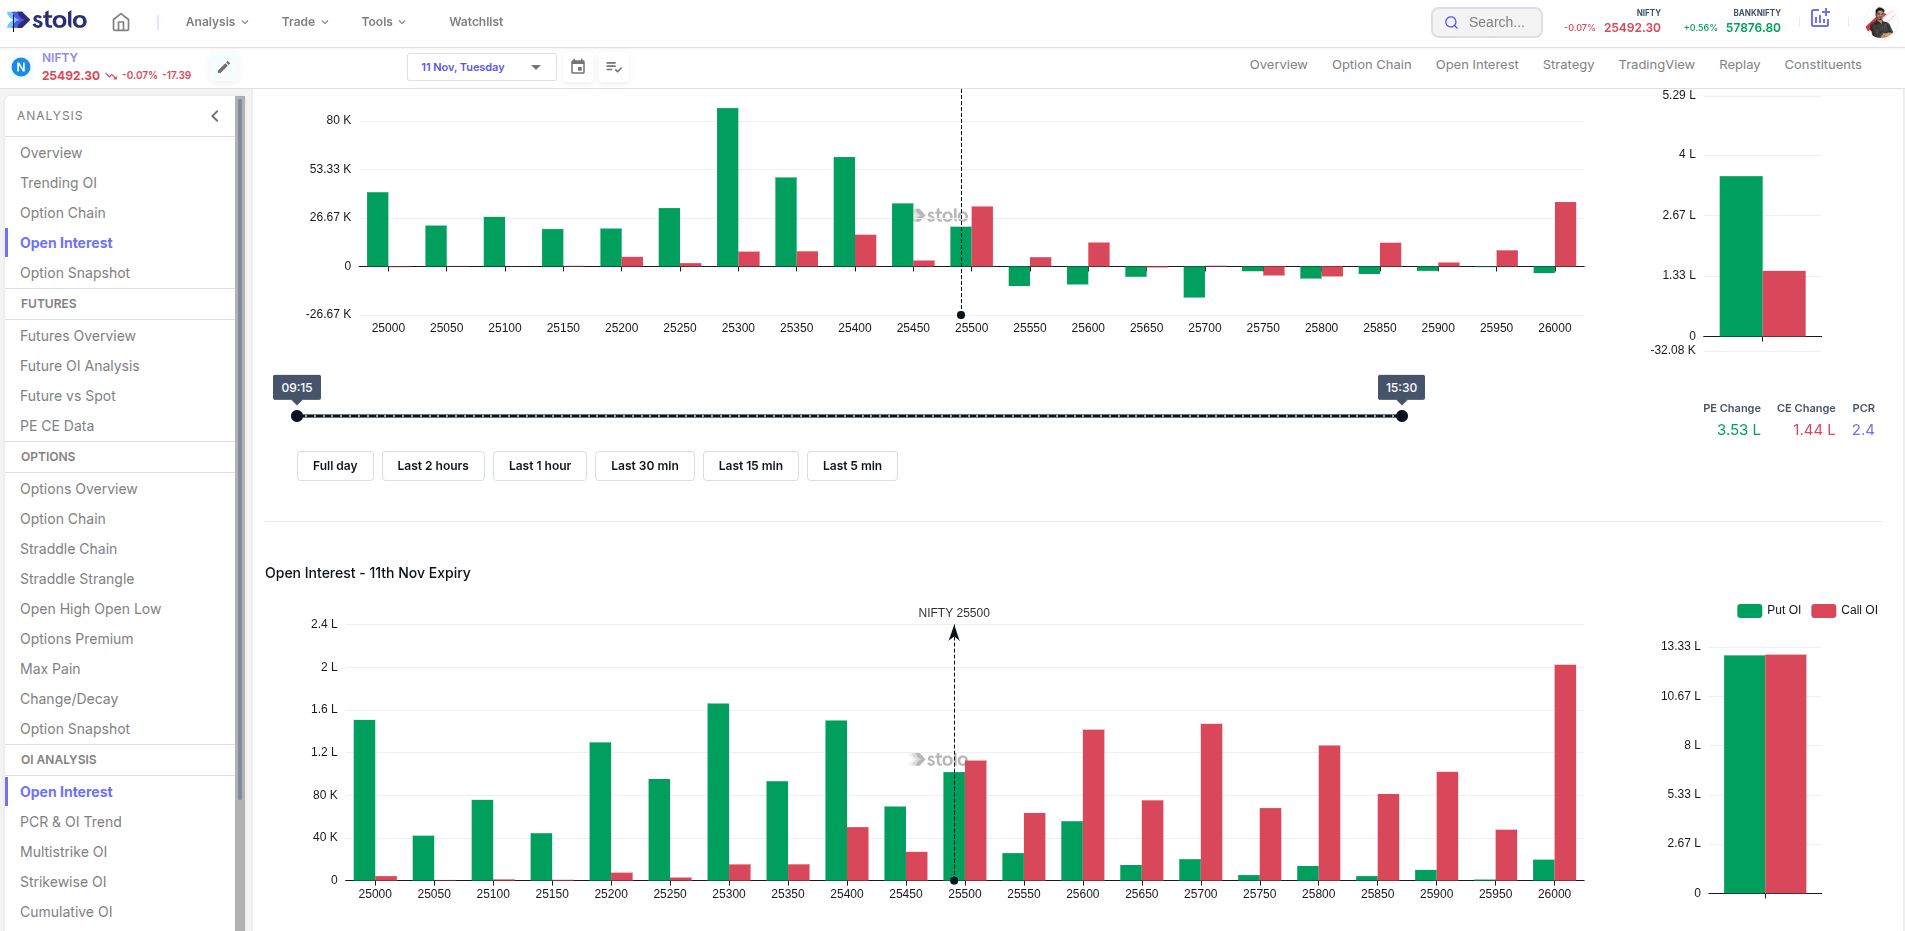
Stolo’s Open Interest converts numbers into narratives .It automatically fetches and visualizes open interest across strikes and expiries, letting you see where traders are placing their bets.
At a glance, you can:
- View live OI build-up across strikes and expiries
- Identify long buildup, short buildup, long unwinding, and short covering
- Compare OI and OI Change for clearer sentiment reading
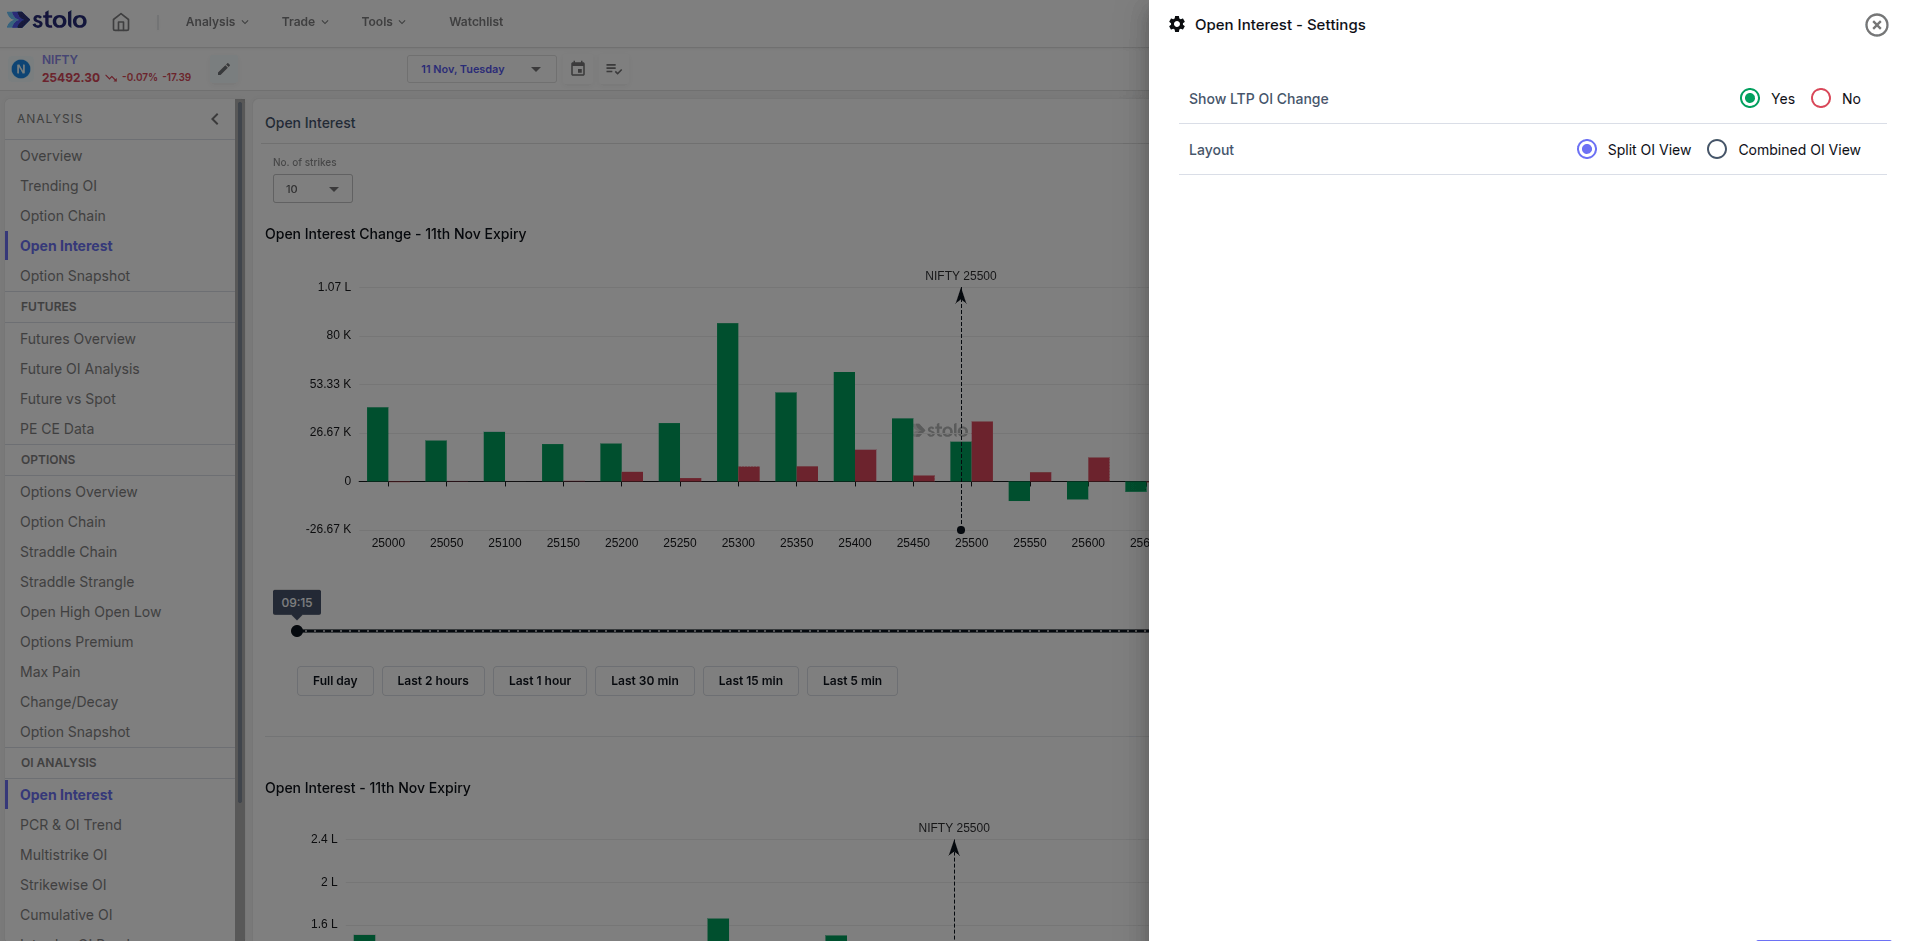
How to Use Open Interest Analysis in Stolo
- Head to Analysis from top menu → Options → Open Interest
- Choose your Index or Stock (e.g., NIFTY, BANKNIFTY)
- Pick expiry and timeframe
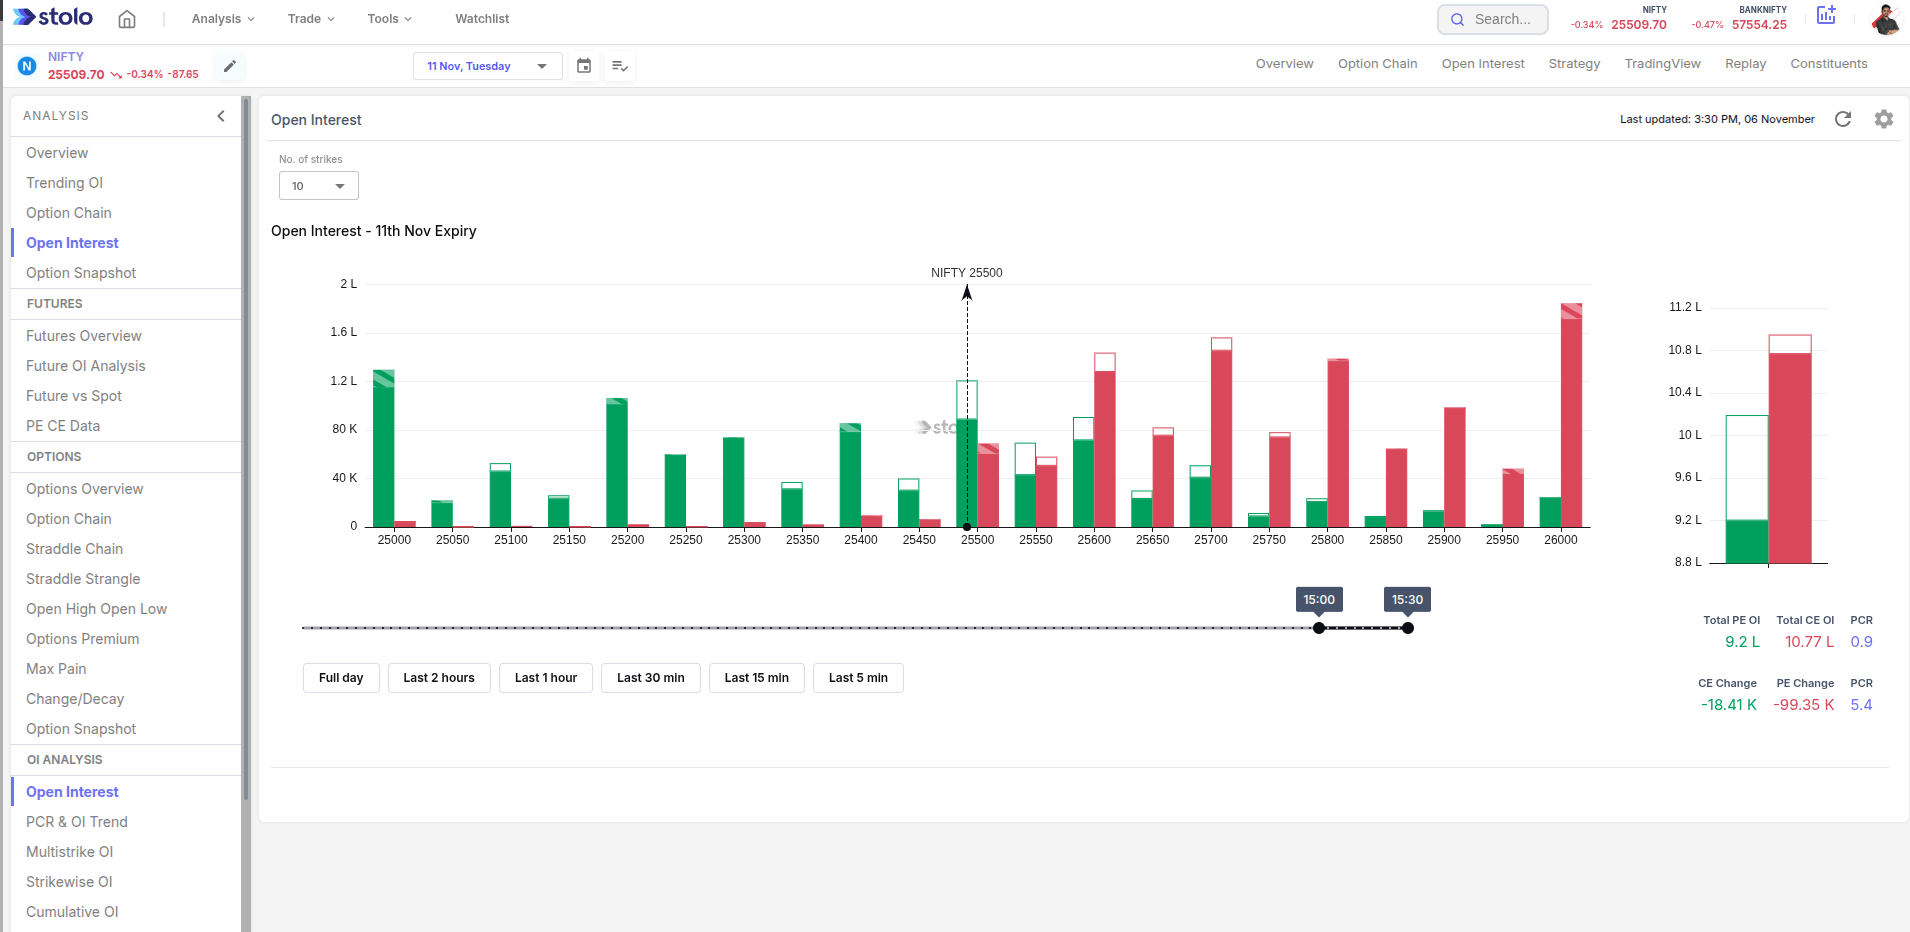
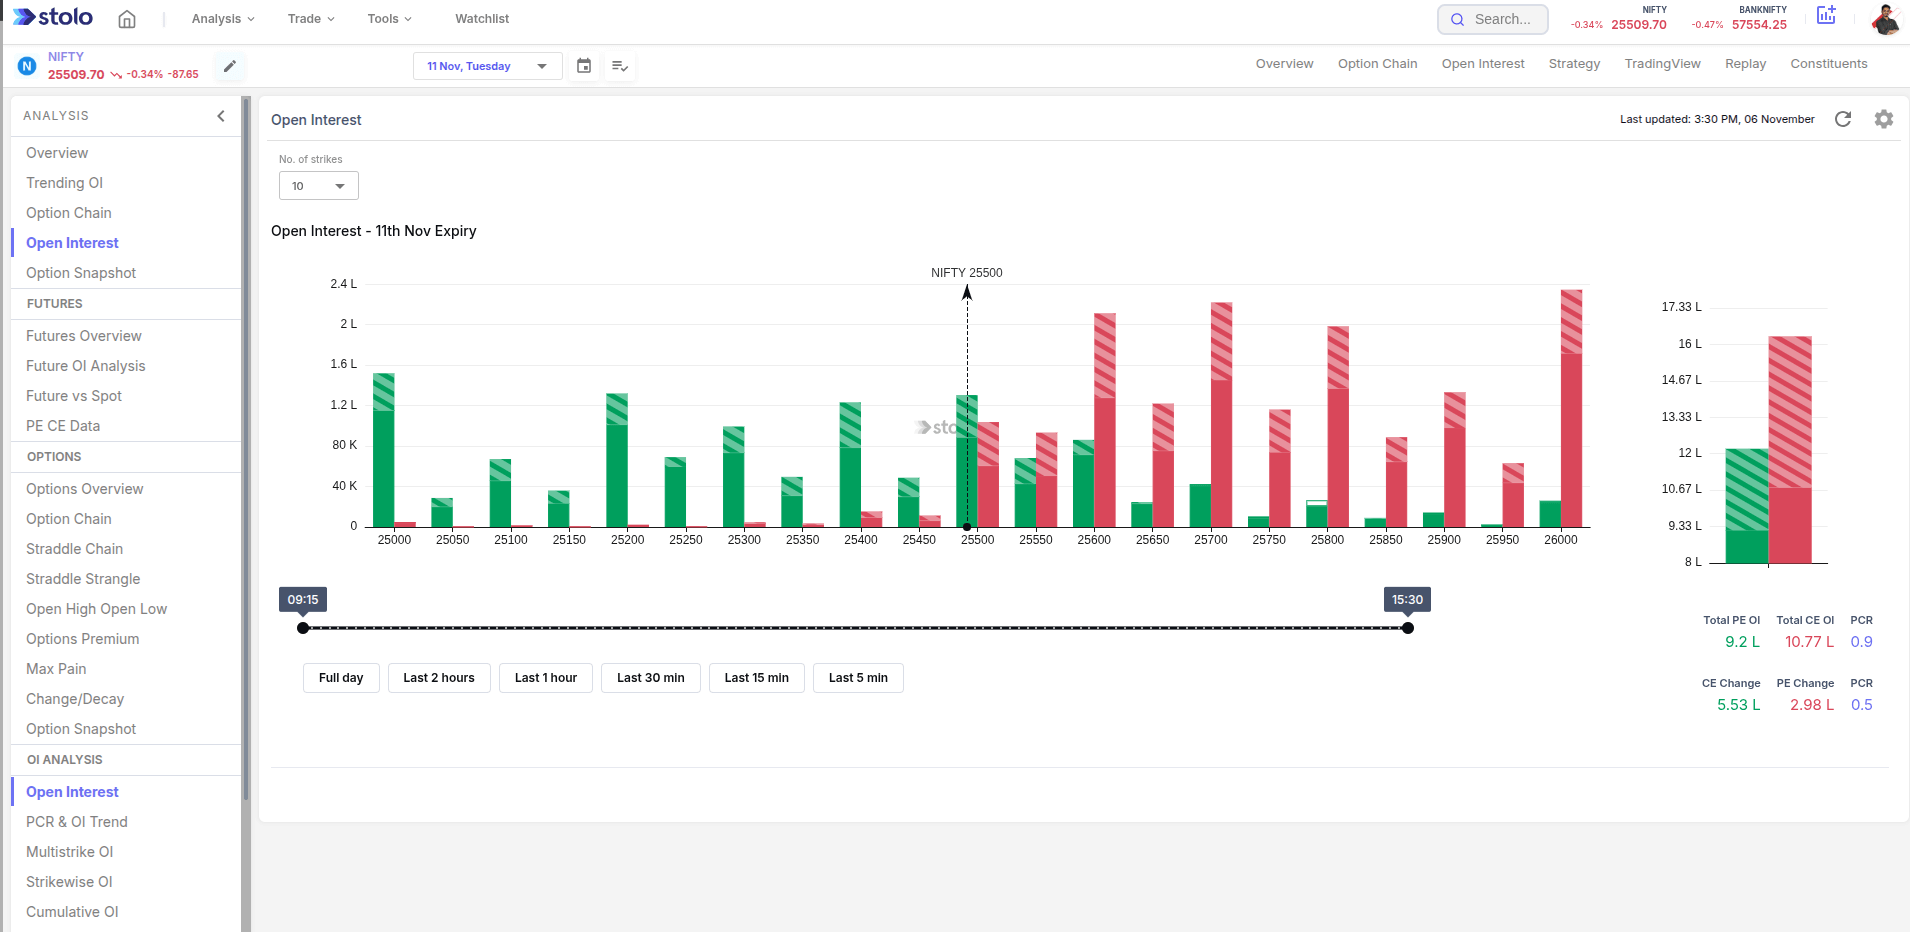
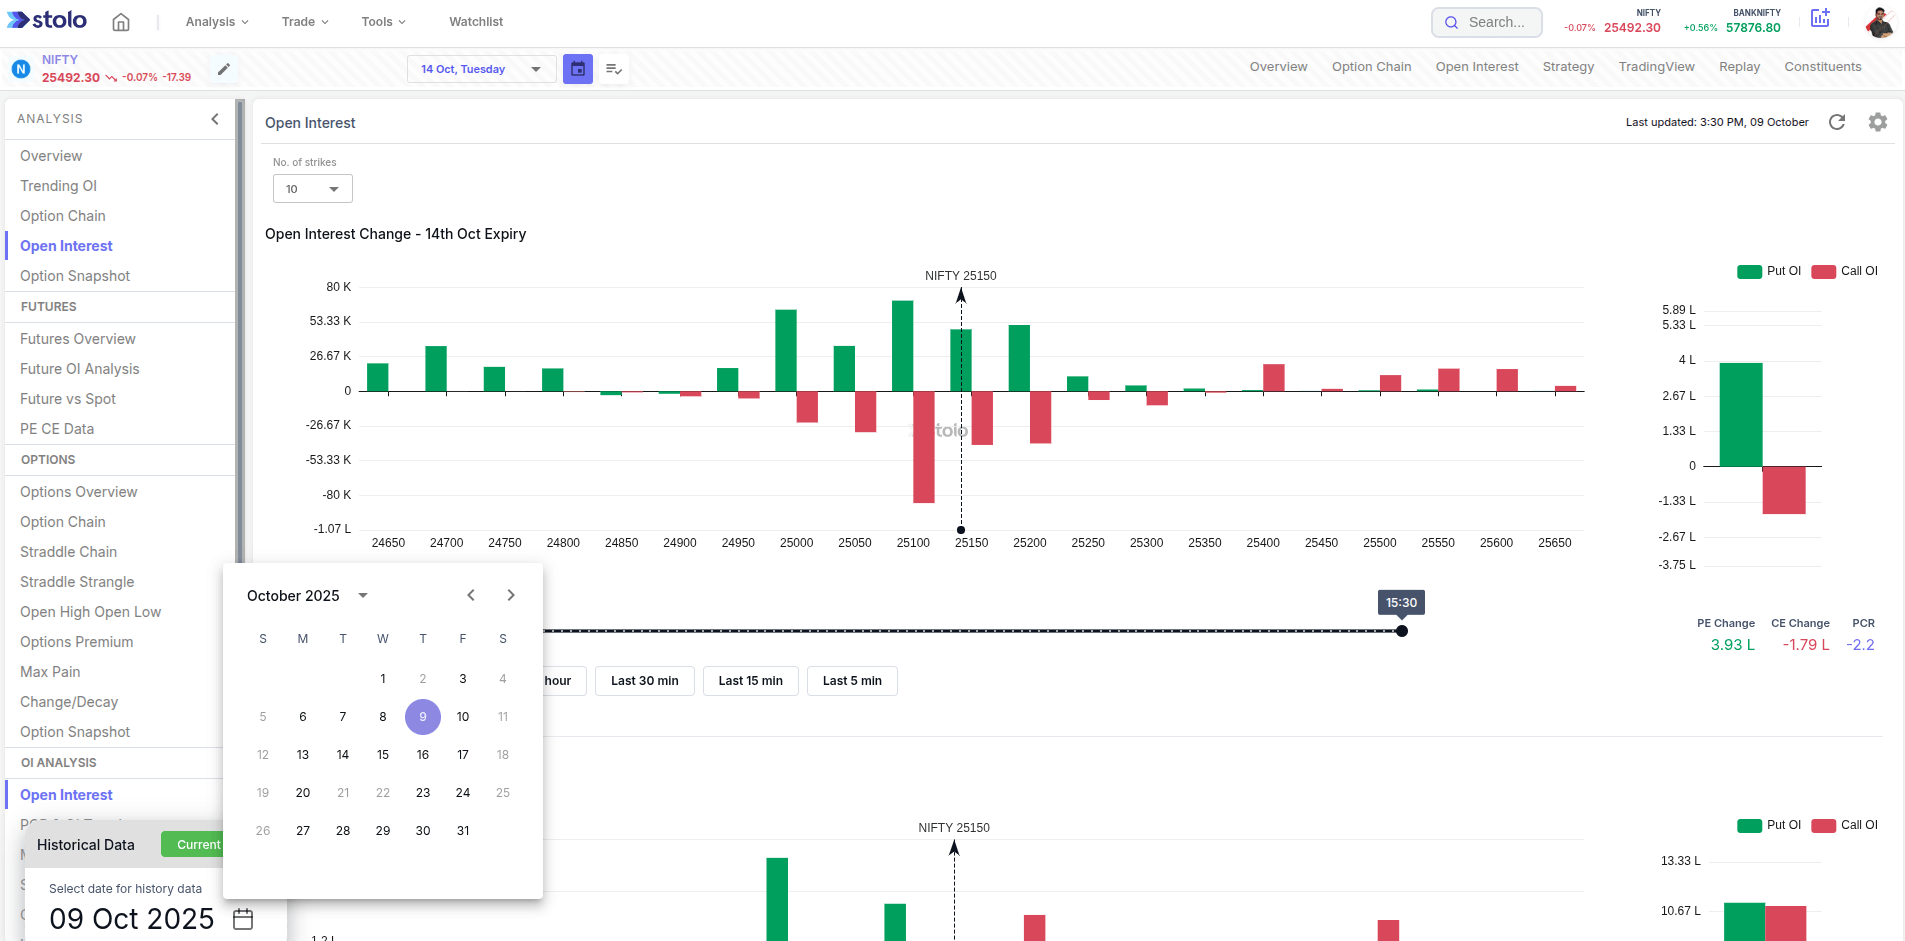
- Watch OI change visualized in live charts with time interval slider
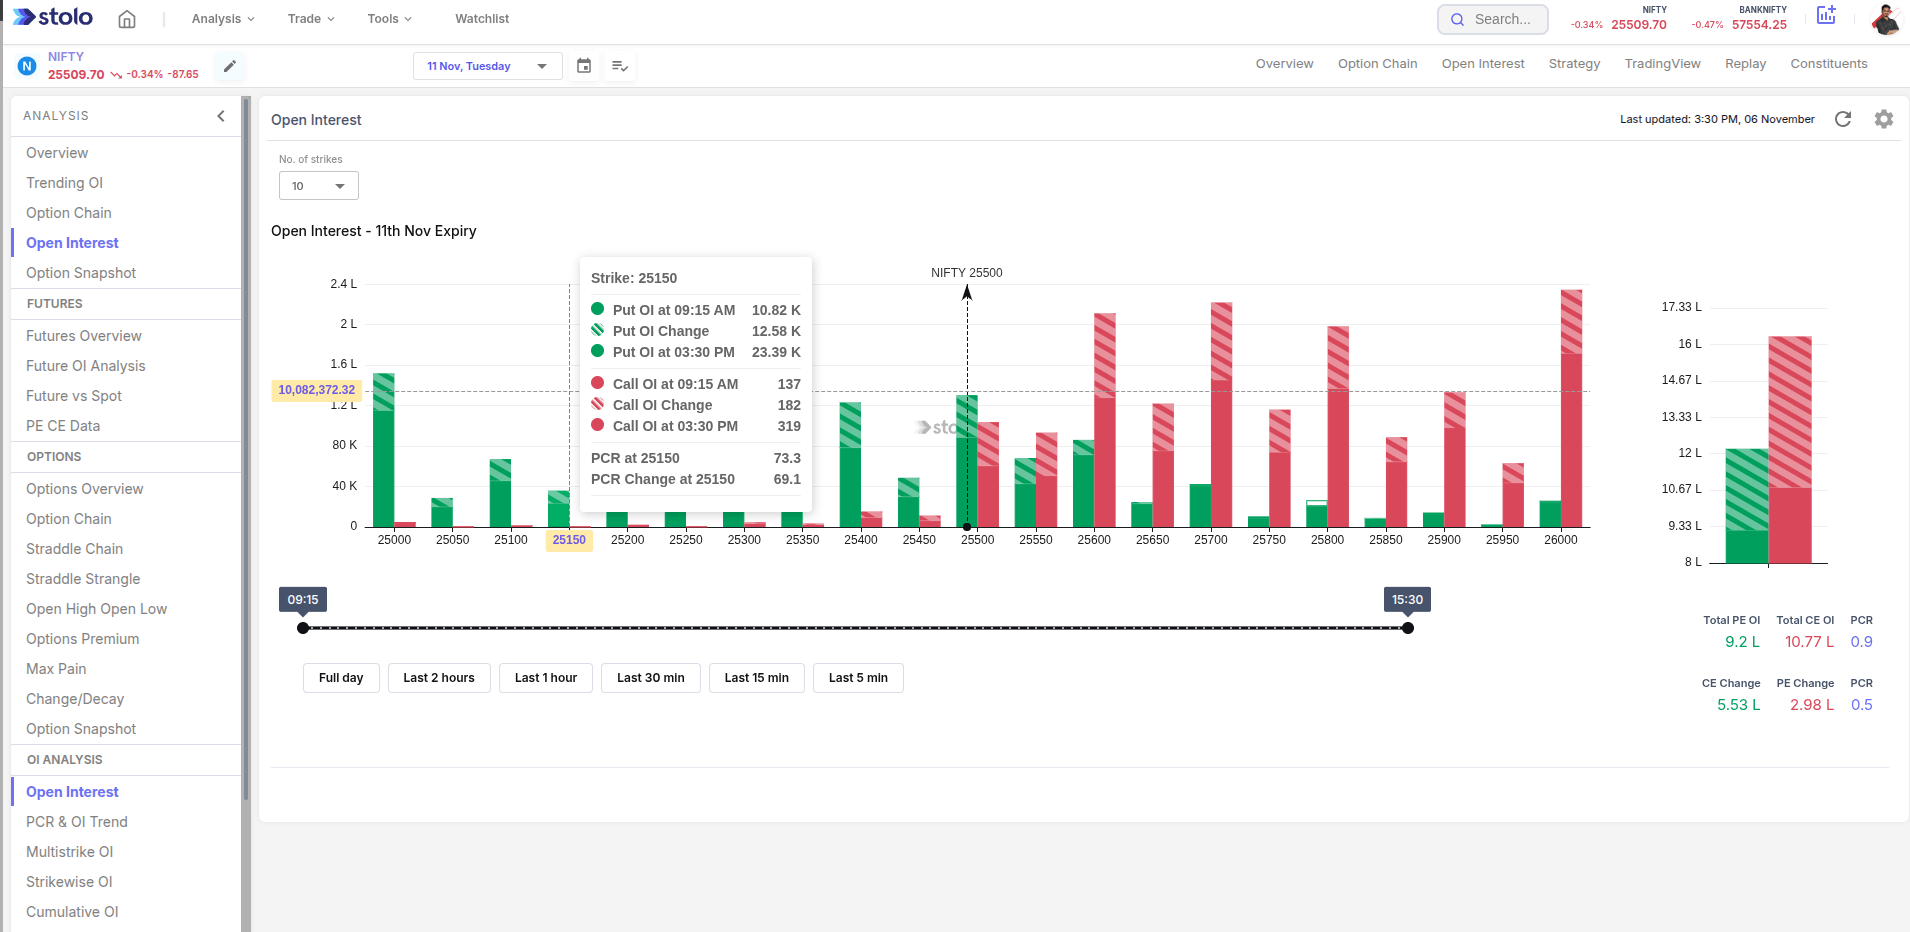
- Hover on bars to see Call vs Put Open Interest data
Why Should you use Open Interest in Stolo
| The Usual Way | The Stolo Way |
|---|---|
| Static OI tables that update slowly | Live OI visualization synced with real-time data |
| No clear way to see overall PCR | Dedicated graph showing overall PCR |
| Complex charts, no context | Clean, color-coded visuals for quick interpretation |
| Standard colored charts | Fully customizable chart colors supporting accessability |
With Stolo, you don’t just see OI numbers you understand what traders are doing behind them.
What You’ll Gain Using Stolo’s Open Interest
- Identify real-time sentiment shifts
- See clear buildup/unwinding patterns
- You can also see OI Change at different time intervals
- Make data-driven entries and exits
Pro tip: Combine "OI Change" with "Price Change" view to identify whether traders are going long, short, or exiting positions.
Frequently Asked Questions
What is Open Interest (OI) in options trading?
How is OI different from volume?
Does Stolo show historical OI data?
Can I see OI for both Calls and Puts?
Ready to Visualize OI Like Never Before?
Try Stolo's Open Interest on your trial plan today, and see how sentiment data becomes your trading edge.
Start with Trial Plan at just ₹299