Understand Market Range and Volatility with Stolo’s Straddle Chain
Straddles are the heartbeat of market expectation — they show how much movement the market is pricing in.
Stolo’s Straddle Chain makes it easy to see how these premiums behave across strikes and expiries, giving you a real-time pulse of volatility.

Challenge Traders Face
Most traders calculate straddles manually adding up Call and Put premiums from the option chain. That’s slow, repetitive, and hard to visualize across multiple strikes. Without a clear visual:
- You can't tell where the market expects the biggest move.
- Comparing straddles across expiries is messy.
- Tracking intraday changes in total premium is nearly impossible.
Stolo’s Straddle Chain is meant to tackle this challenge, letting you visualize total option premiums across strikes and expiries instantly.
Understanding Stolo’s Straddle Chain
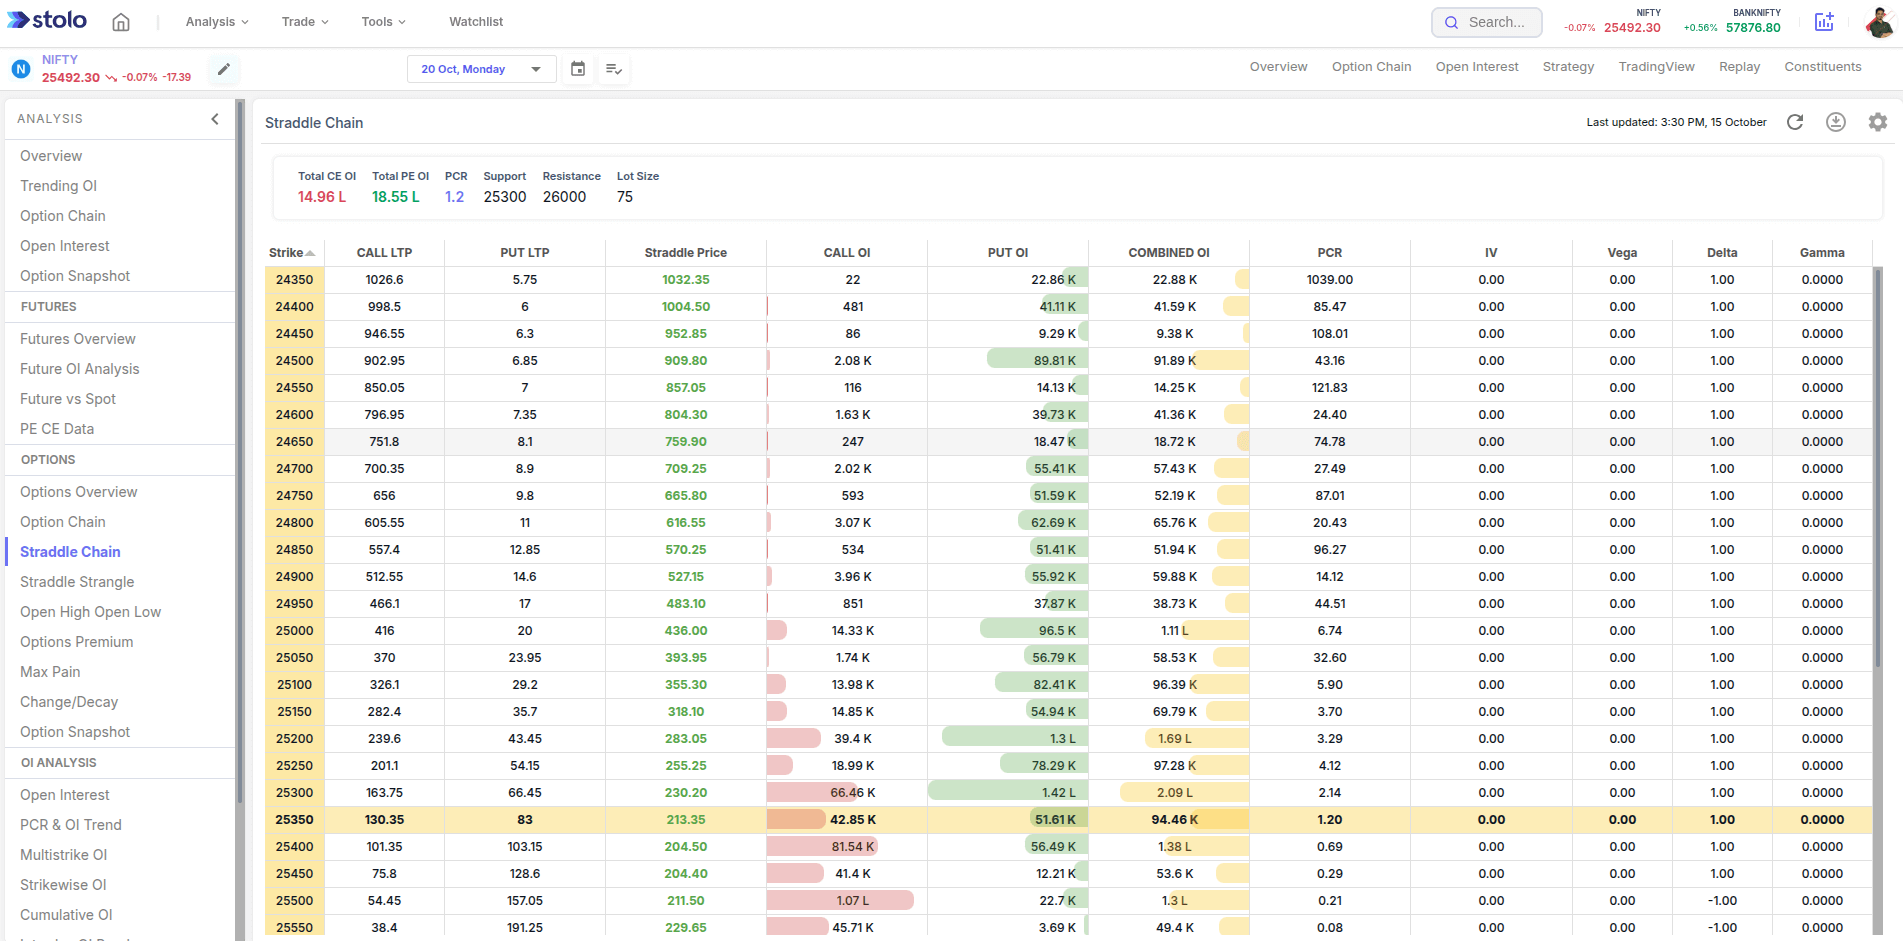
The Straddle Chain in Stolo plots the total premium ie., Straddle Price (Call + Put) for every strike of a chosen expiry. It’s the most intuitive way to read what the market thinks about range, volatility, and time decay.
- You can see Call LTP, Put LTP
- You will be able to see Call OI, Put OI and Combined OI
- You can also see PCR
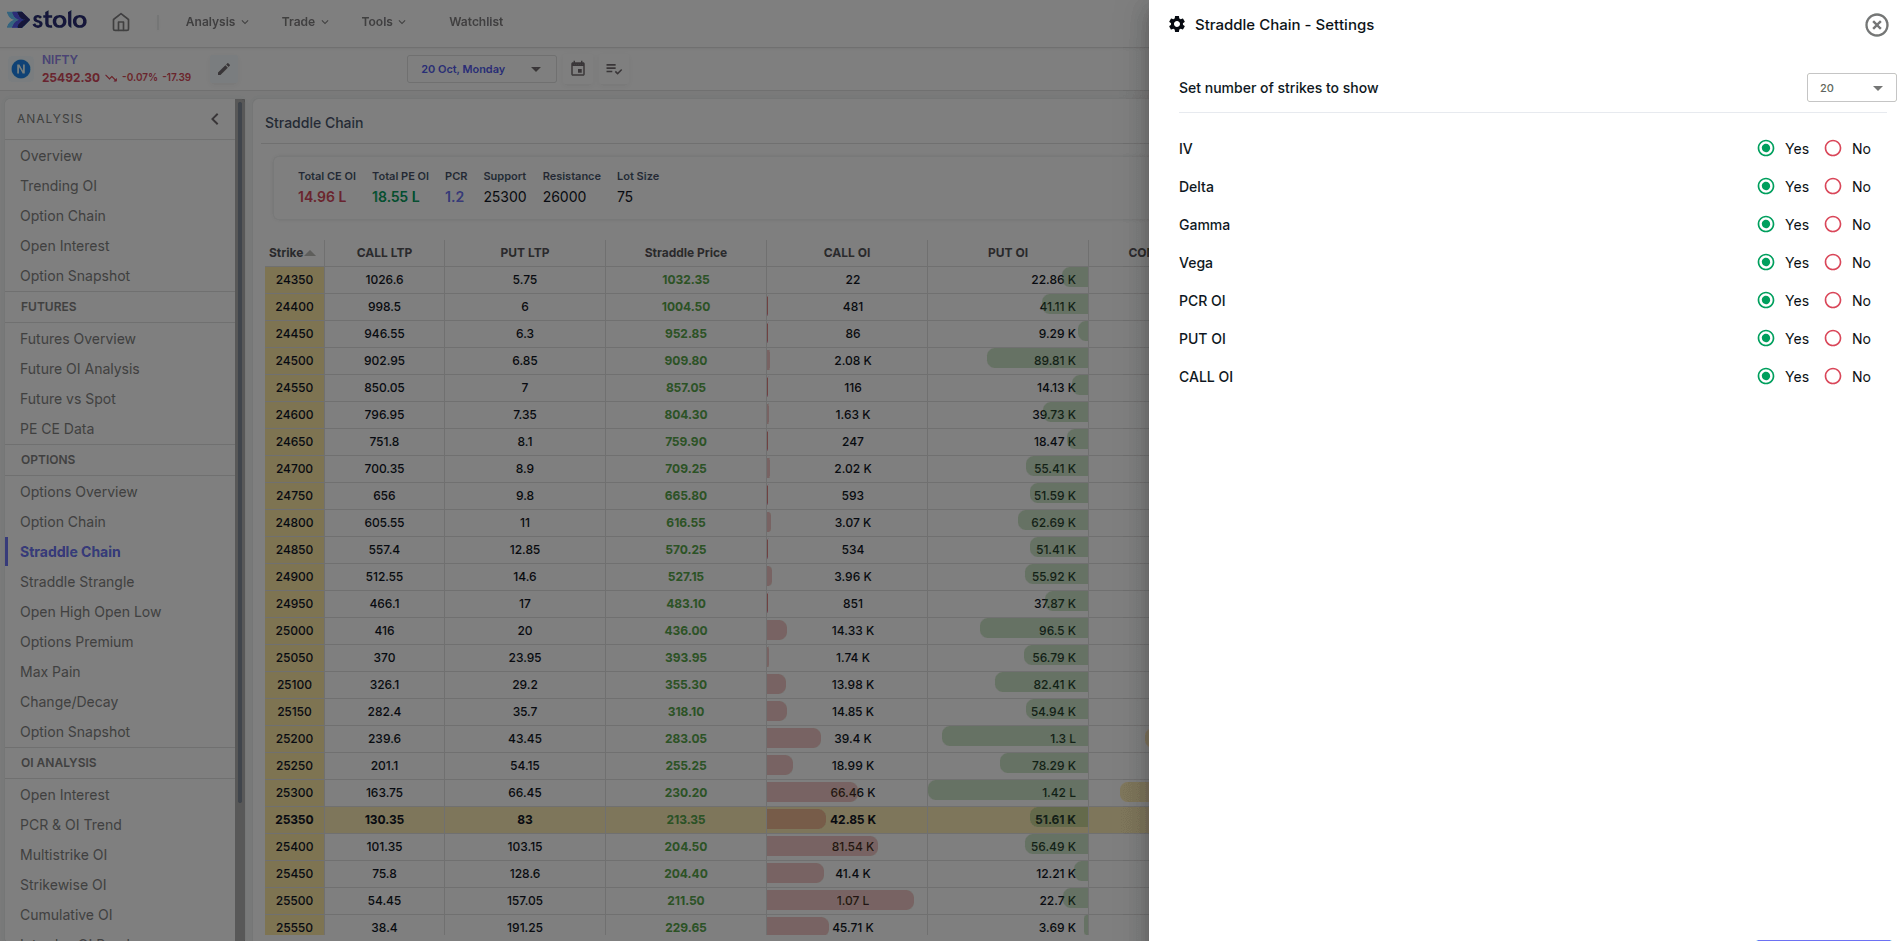
- You can customise what columns you would wish to see in the straddle chain by clicking on settings icon
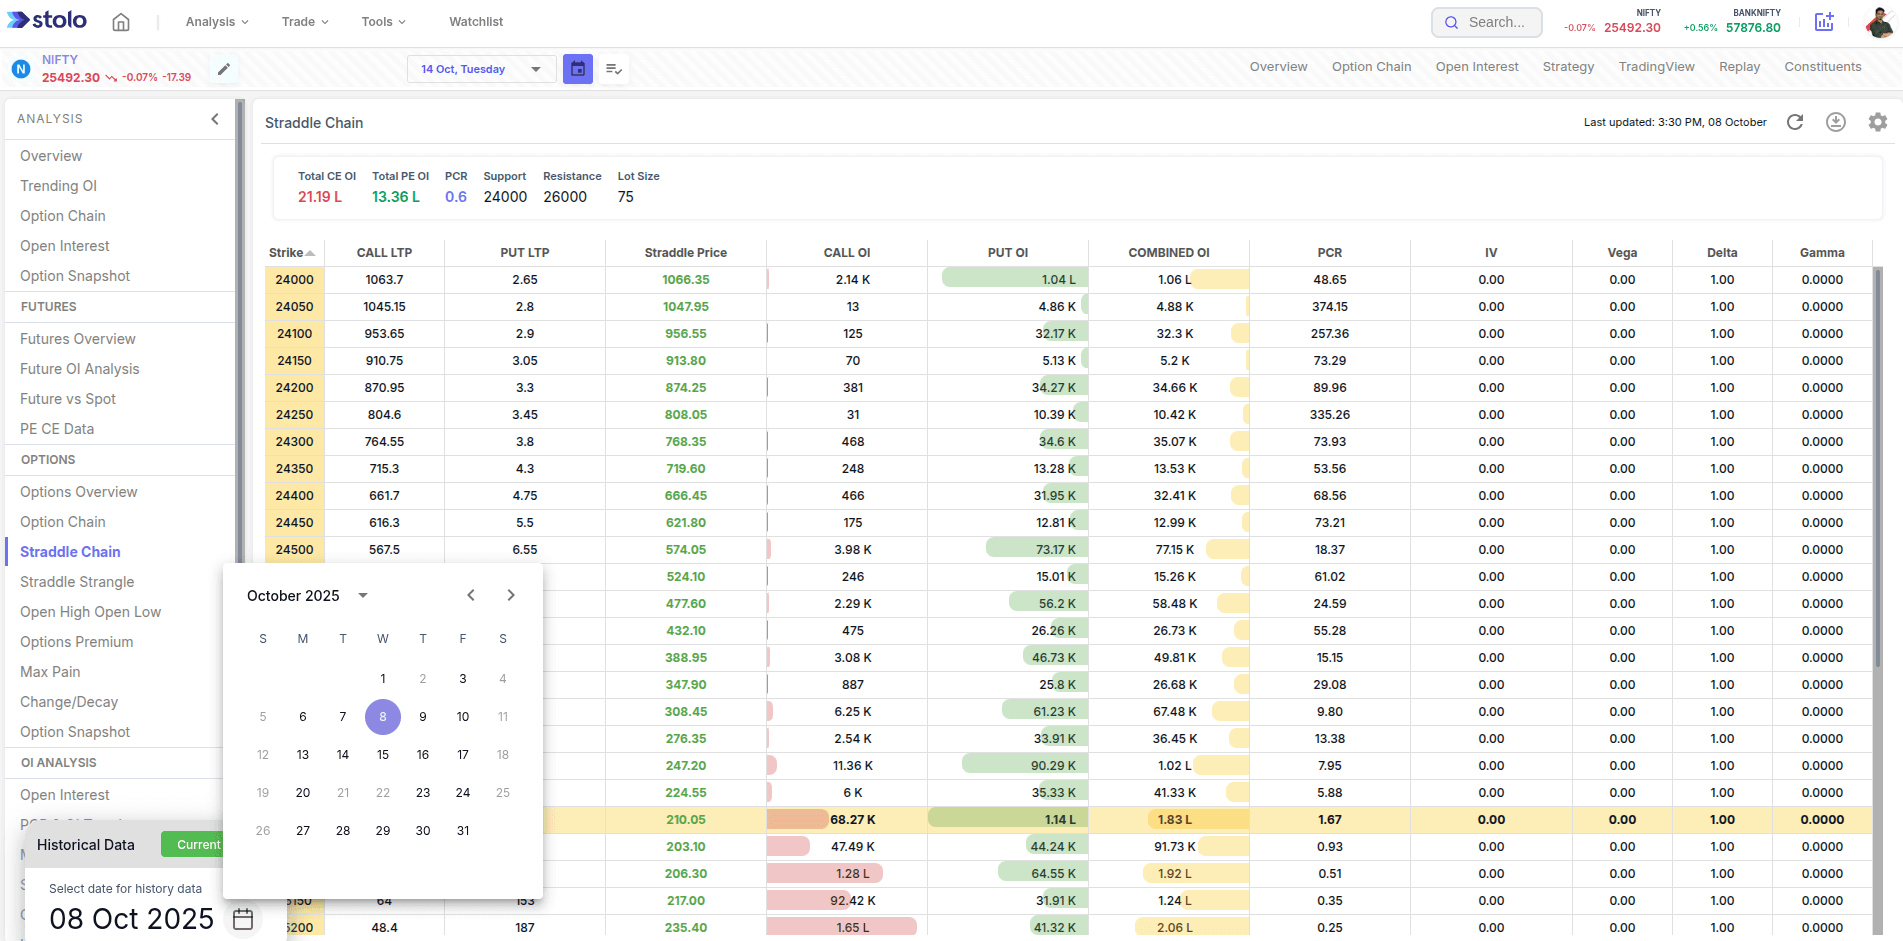
- Stolo also provides historical data for the Straddle chain.
How to use Straddle Chain in Stolo
- Go to Analysis → Options -> Straddle Chain
- Choose your instrument (NIFTY, BANKNIFTY, or stock)
- Select the expiry you want to study
- The straddle chain table will display all the data for the selected expiry and instrument
- Use the settings icon to add/remove columns you wish to see in straddle chain data
- Use download icon to export data as CSV/Excel
- Use the calendar icon to choose a historical date and see the relevant information.
Frequently Asked Questions
What does the Straddle Chain show?
How is StraddleChain different from the Straddle-Strangle Chart?
Can I compare different expiries in the Straddle Chain?
What instruments are supported in Straddle Chain?
Visualize Volatility Instantly with Straddle Chain
Try Stolo’s Straddle Chain today and watch how total option premiums reveal the market’s heartbeat.
Start with Trial Plan at just ₹299