How to Read and Analyze an Option Chain Using Stolo
Option Chain tables can look intimidating with dozens of numbers, colors, and strike prices. But behind all that data lies the real story of market sentiment. Stolo makes it effortless to read and act on that story.
Option Chain in Stolo
Real Challenge
Every trader has seen the option chain and few truly know how to use it.
On broker platforms, option chains are often raw, text-heavy, and hard to interpret. You see prices, OI, IV, and volume but it’s not obvious what’s actually happening:
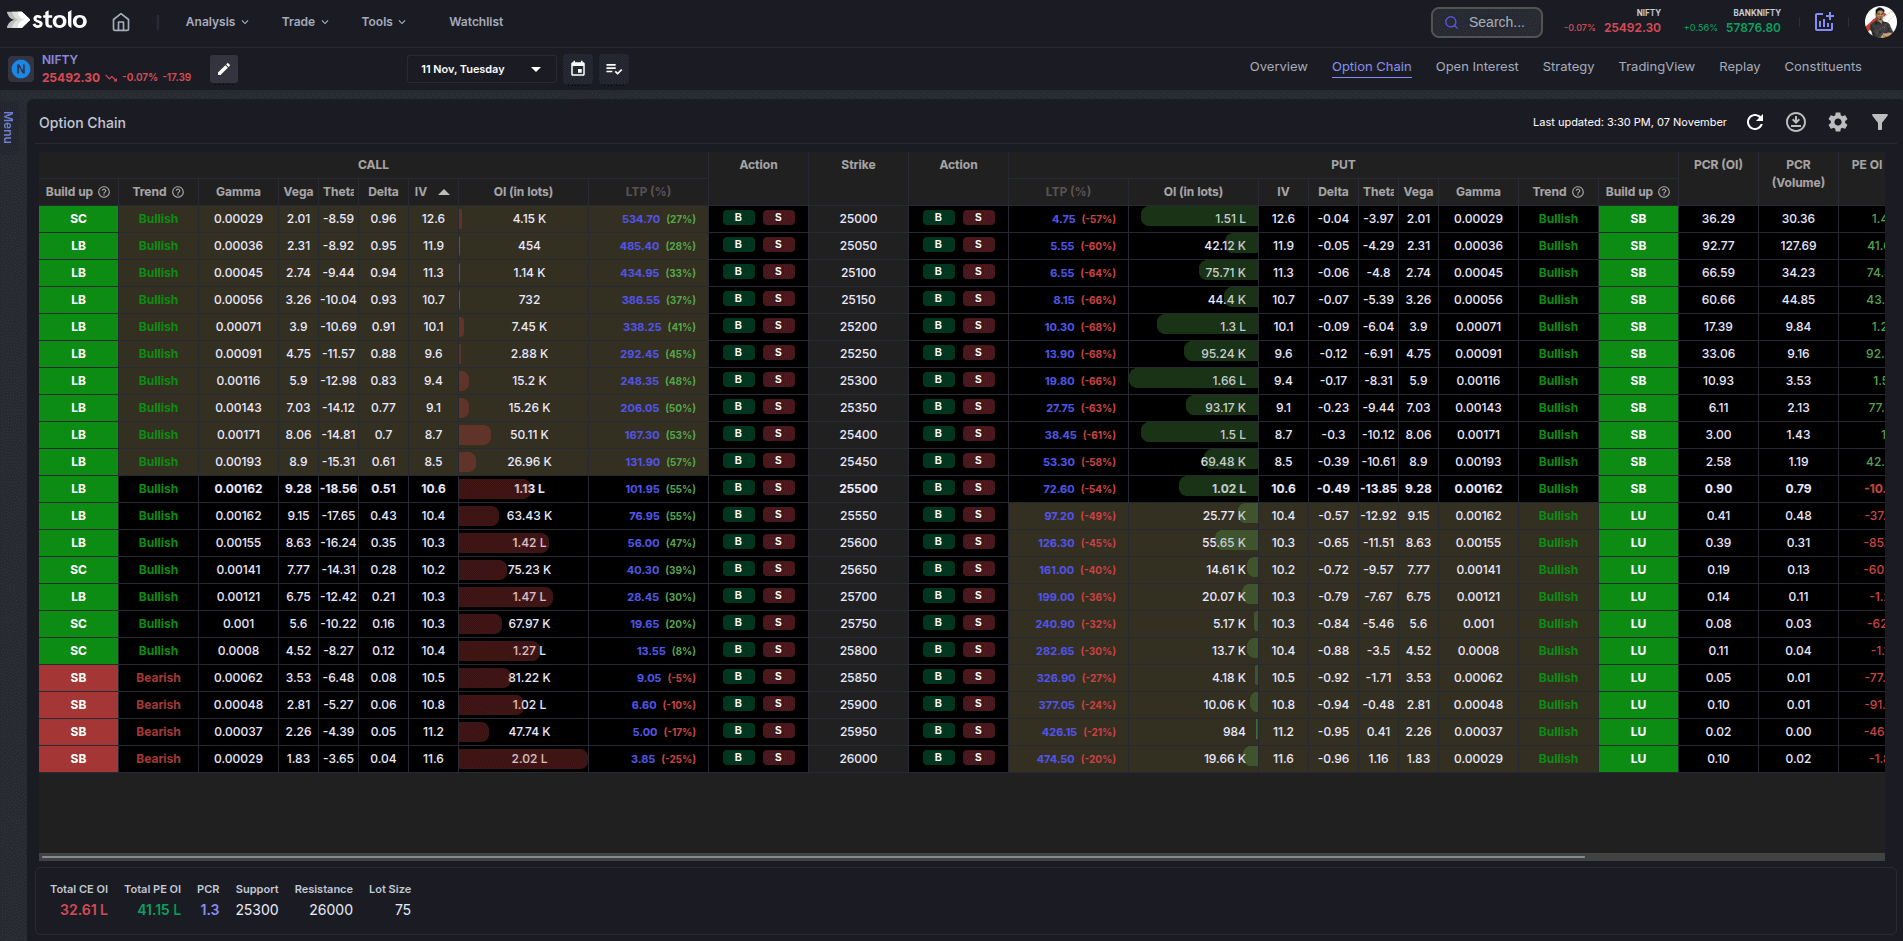
Introducing Stolo’s Option Chain
The Stolo Option Chain isn’t just another table. It’s interactive and is designed for quick interpretation and smarter trading decisions.
Here’s what makes it powerful:
- Color-coded visualization of Call and Put data
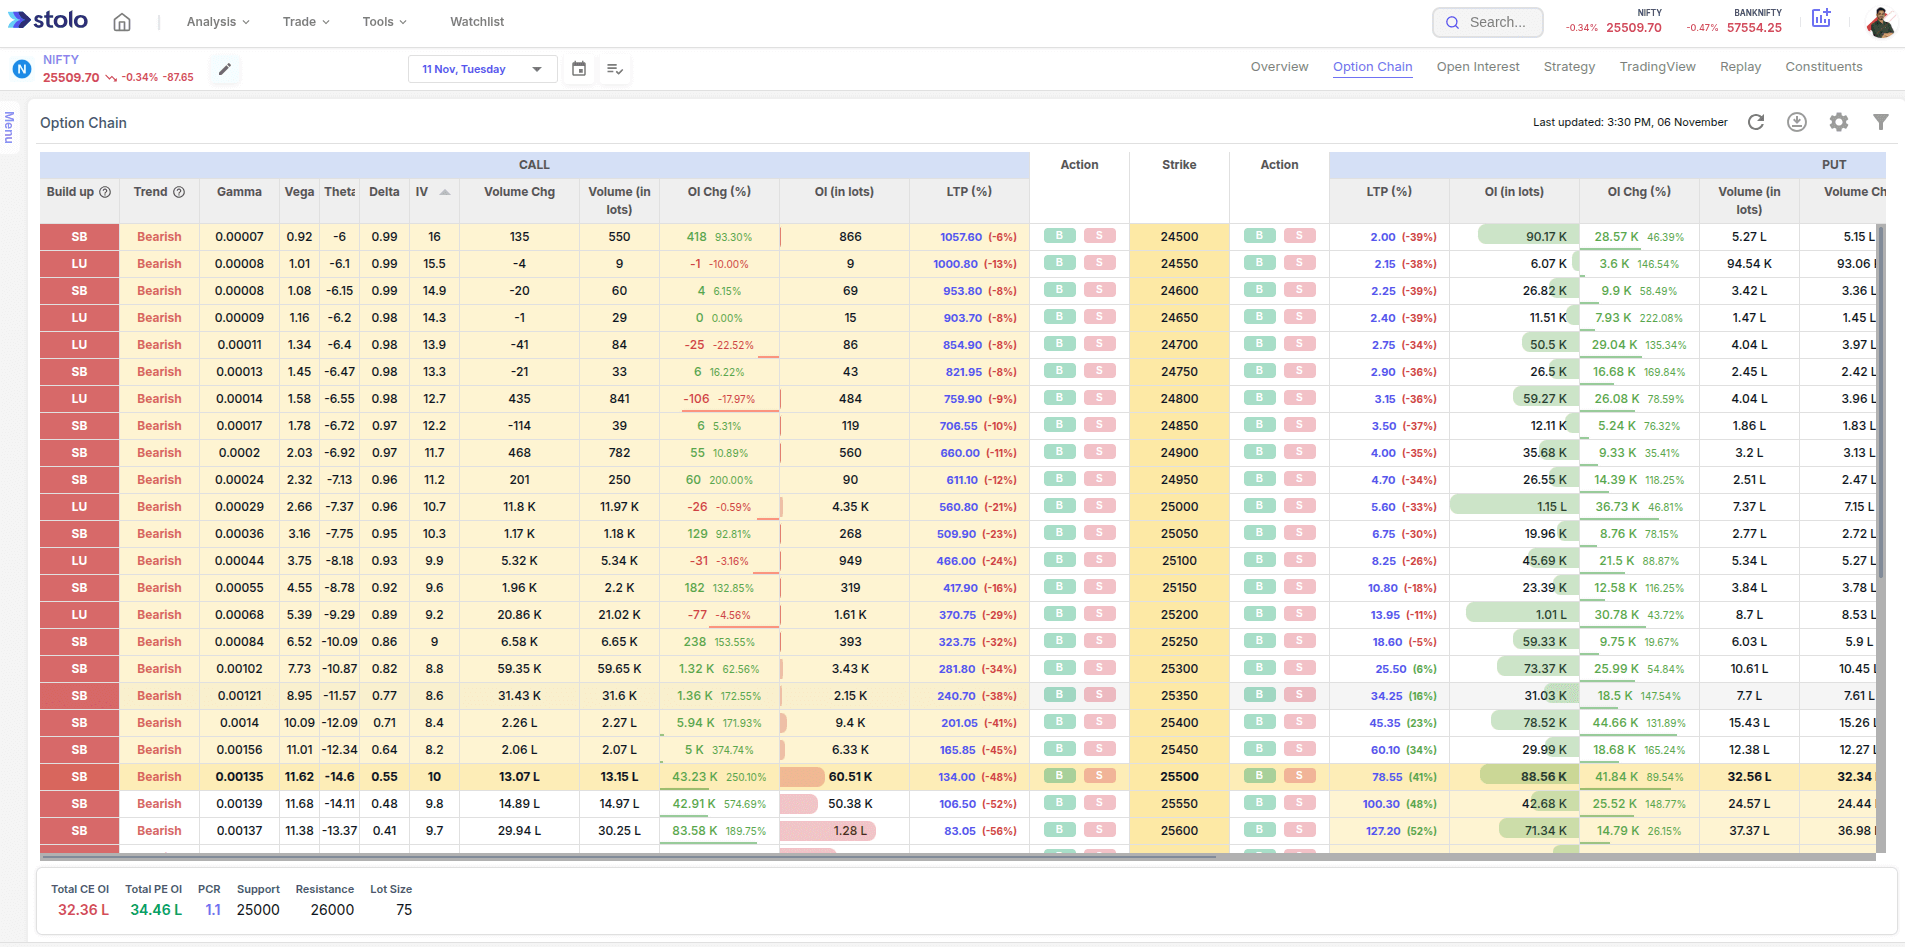
- Instant OI, Volume, LTP, and IV updates
- Buildup classification (Long, Short, Unwinding, Covering)
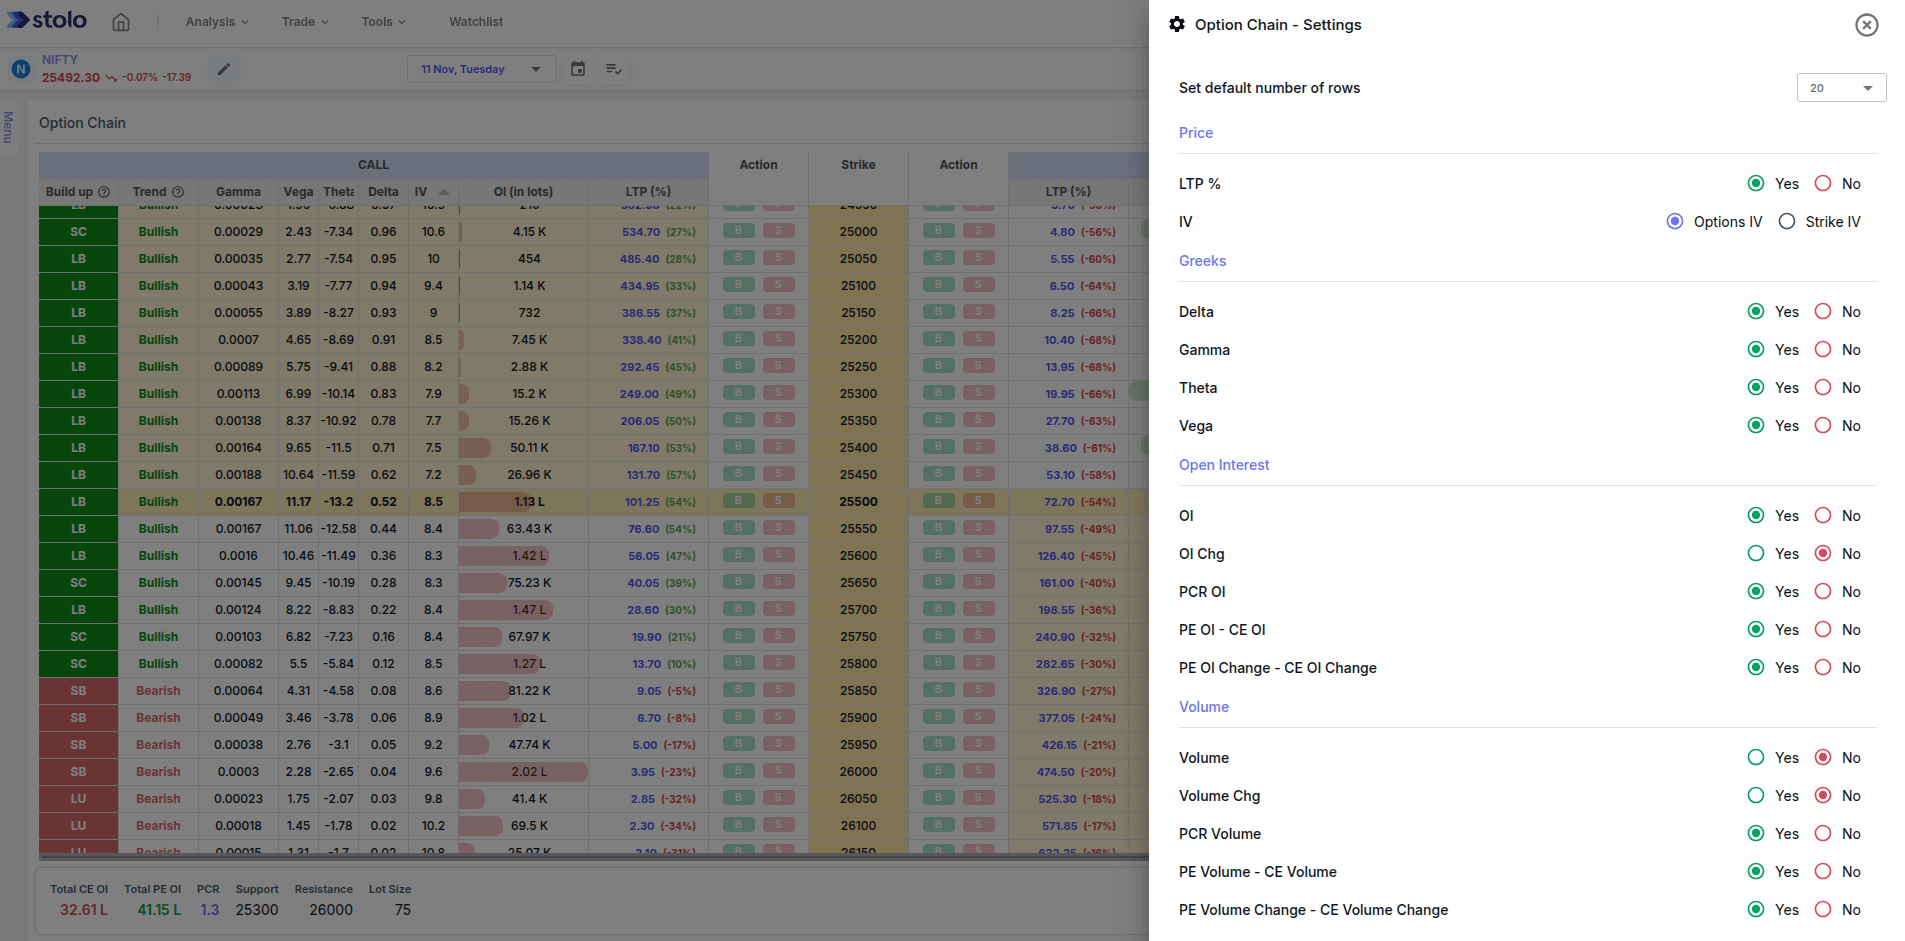
- Customise Option Chain as per your need. Set what columns you wish to see (Greeks, Volume, LTP, OI Change, Trends and much more)
- Option chain for NIFTY, BANKNIFTY, and top F&O stocks
You don’t need to juggle between broker data and Excel anymore Stolo connects it all.
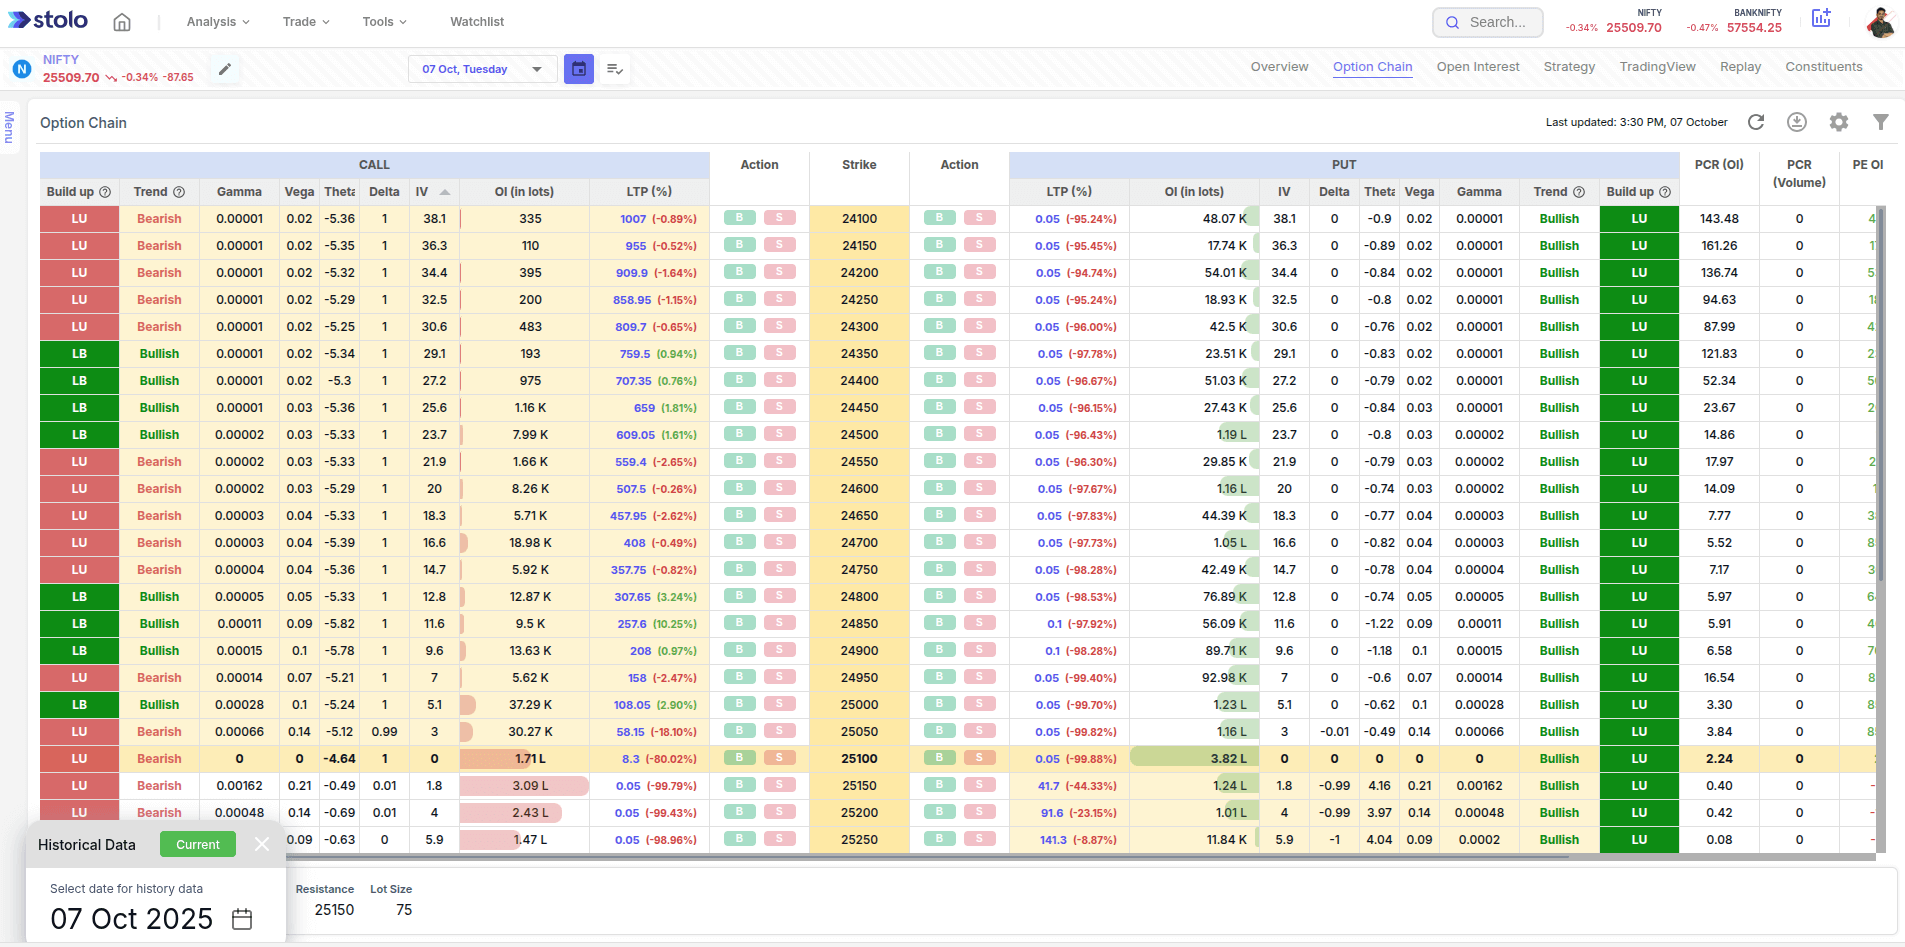
Viewing History Data on Option Chain
- Navigate to Option Chain analysis in Stolo
- Click on Calendar icon next to Expiry element in the top bar
- Choose a desired history date from calendar and the Option Chain loads the respective data
Frequently Asked Questions
What is an Option Chain?
Why is Option Chain analysis important?
Does Stolo show live Option Chain data?
Can I view historical Option Chain data on Stolo?
Did You Know?
Option Chain zones where OI clusters heavily often act as short-term barriers. Watching how they shift intraday may give you early clues about breakouts.
Ready to Read the Market the Smart Way?
Explore the Option Chain on Stolo - real-time, interactive, and made for traders who want clarity over chaos
Start with Trial Plan at just ₹299