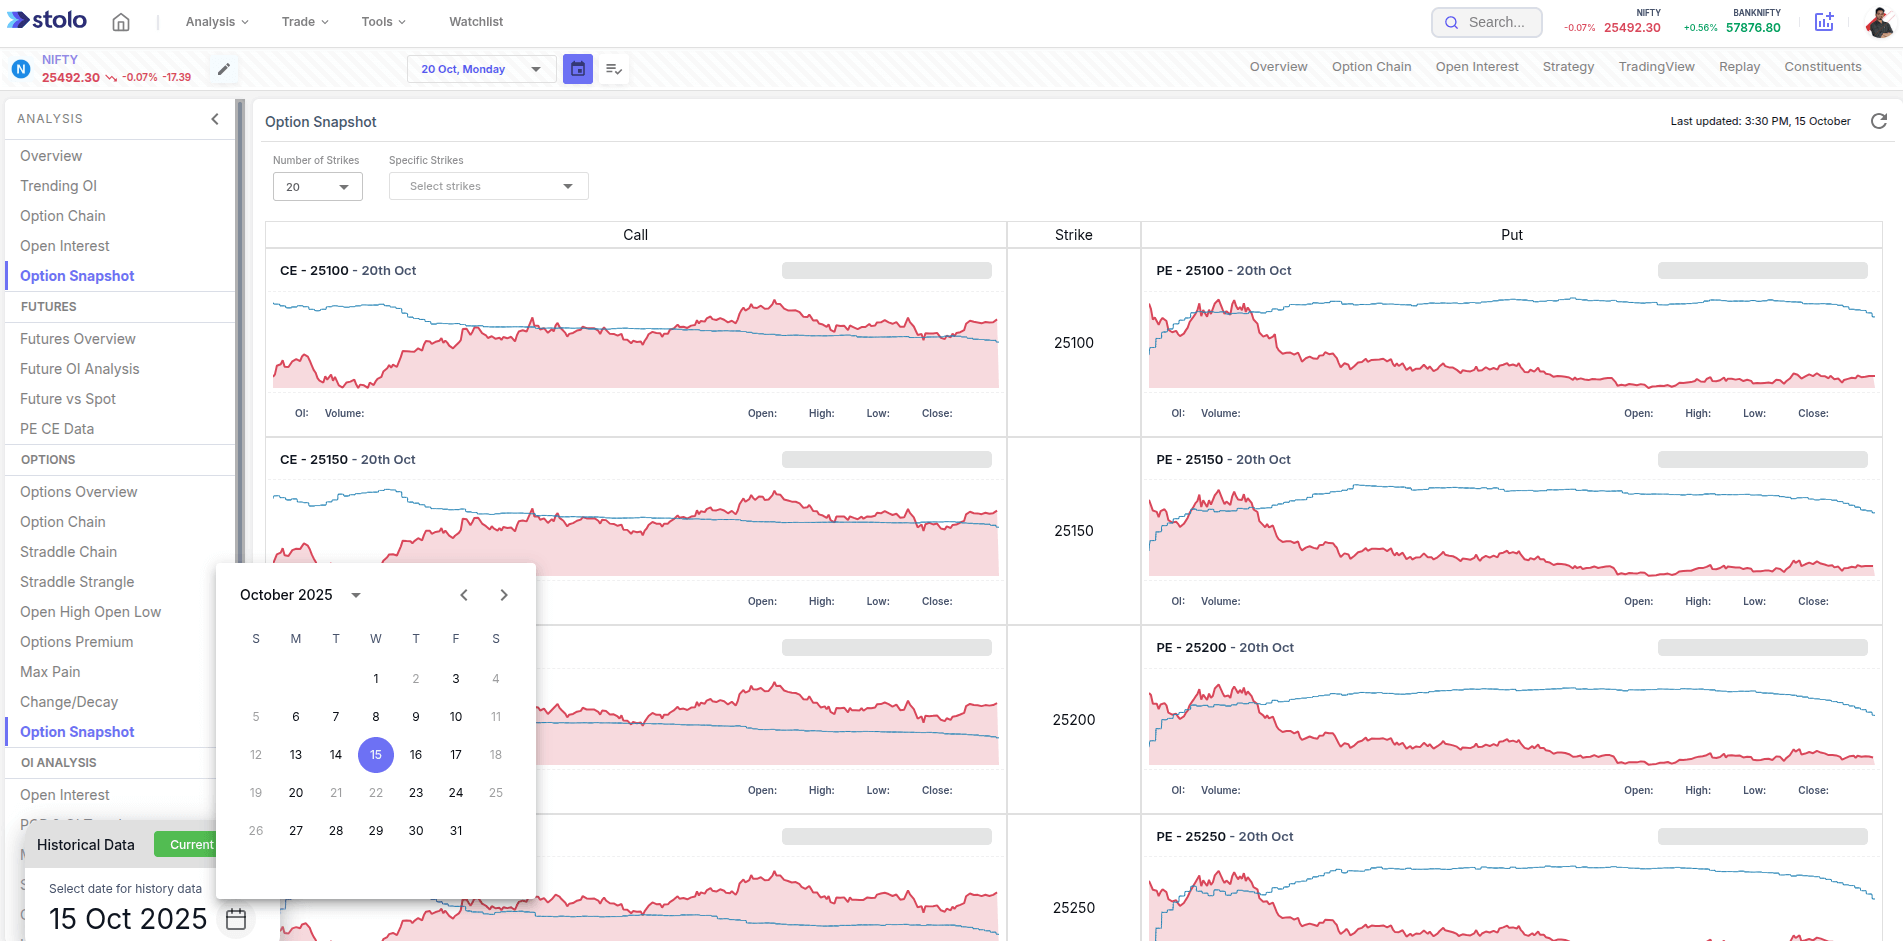
Analyze Every Strike Visually with Stolo’s Option Snapshot Chart
Option data shouldn't just be in live tables alone. That’s why we decided to bring a visual view of the same data in Option Snapshot charts.
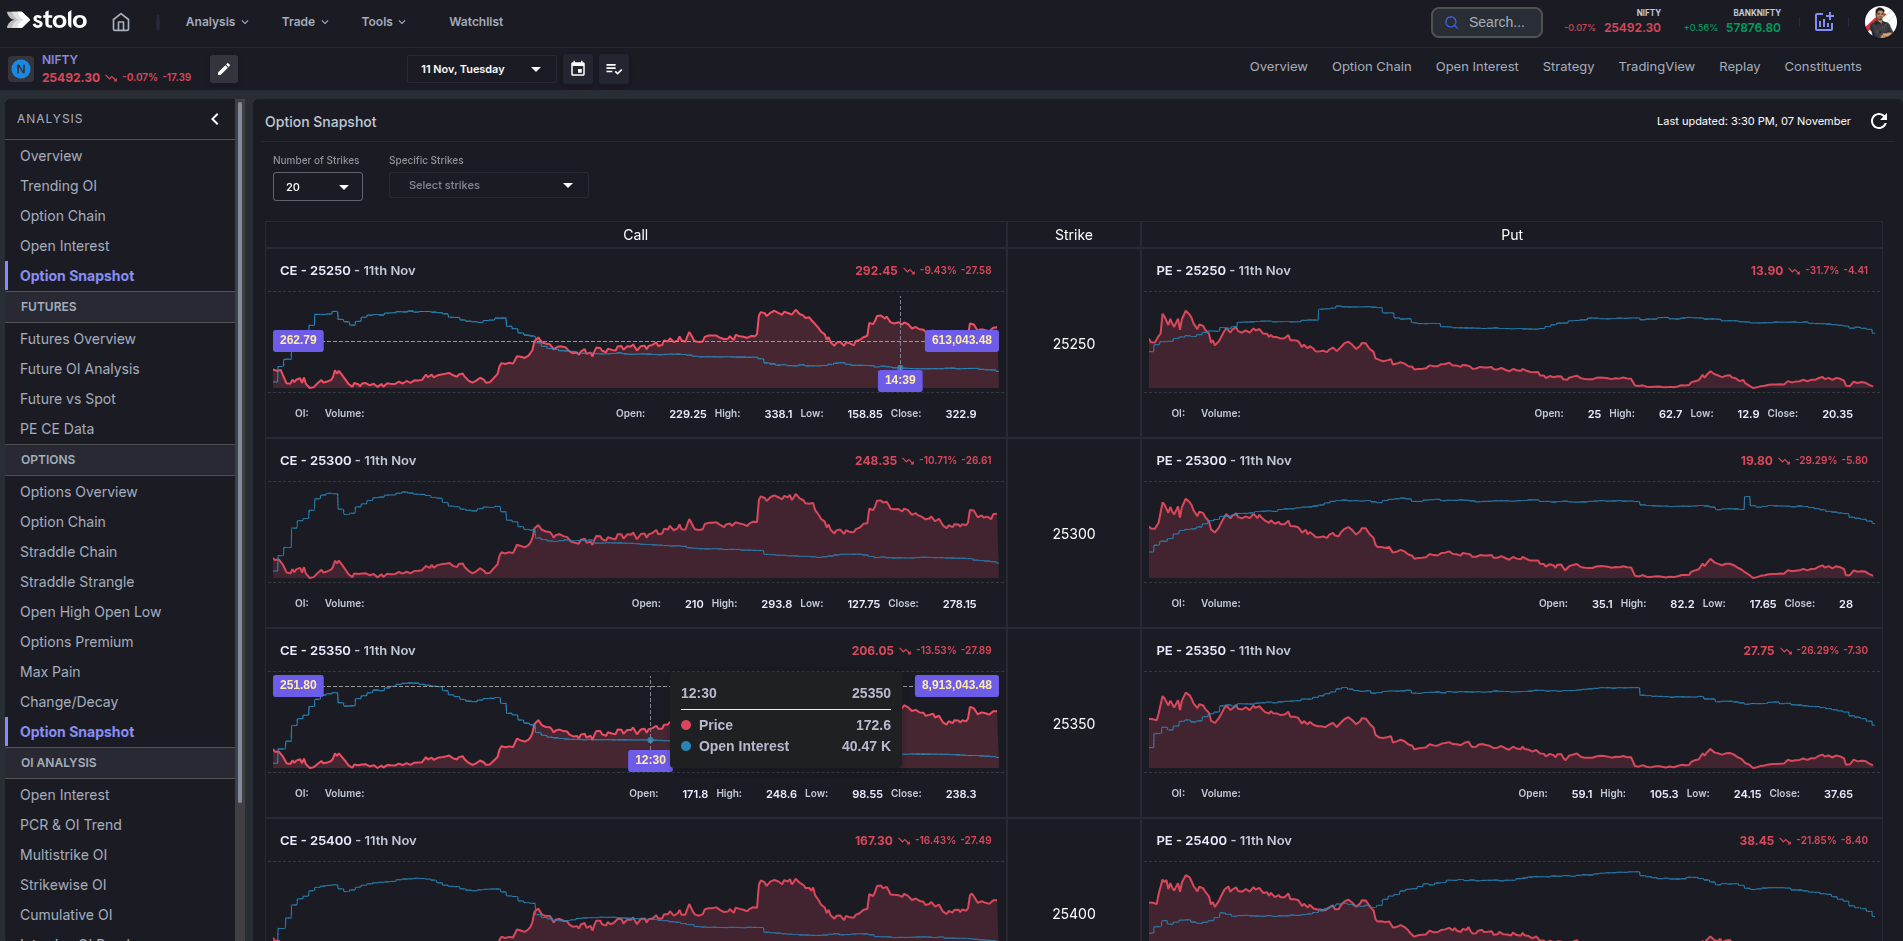
Stolo’s Option Snapshot Chart turns every strike of an expiry into a visual story, showing how prices and open interest evolve together through the session.
Challenges Traders Face
For most traders, analyzing multiple strikes means endless scrolling through broker option chains, trying to mentally track which strikes are gaining OI or moving fast.
The challenge:
- You can't see how each strike behaves intraday.
- Comparing OI and OHLC requires switching between screens.
- Identifying which strikes are being defended or attacked becomes guesswork. Stolo’s Option Snapshot Chart brings it all together, one expiry, multiple strikes, full visual clarity.
Introducing Stolo’s Option Snapshot
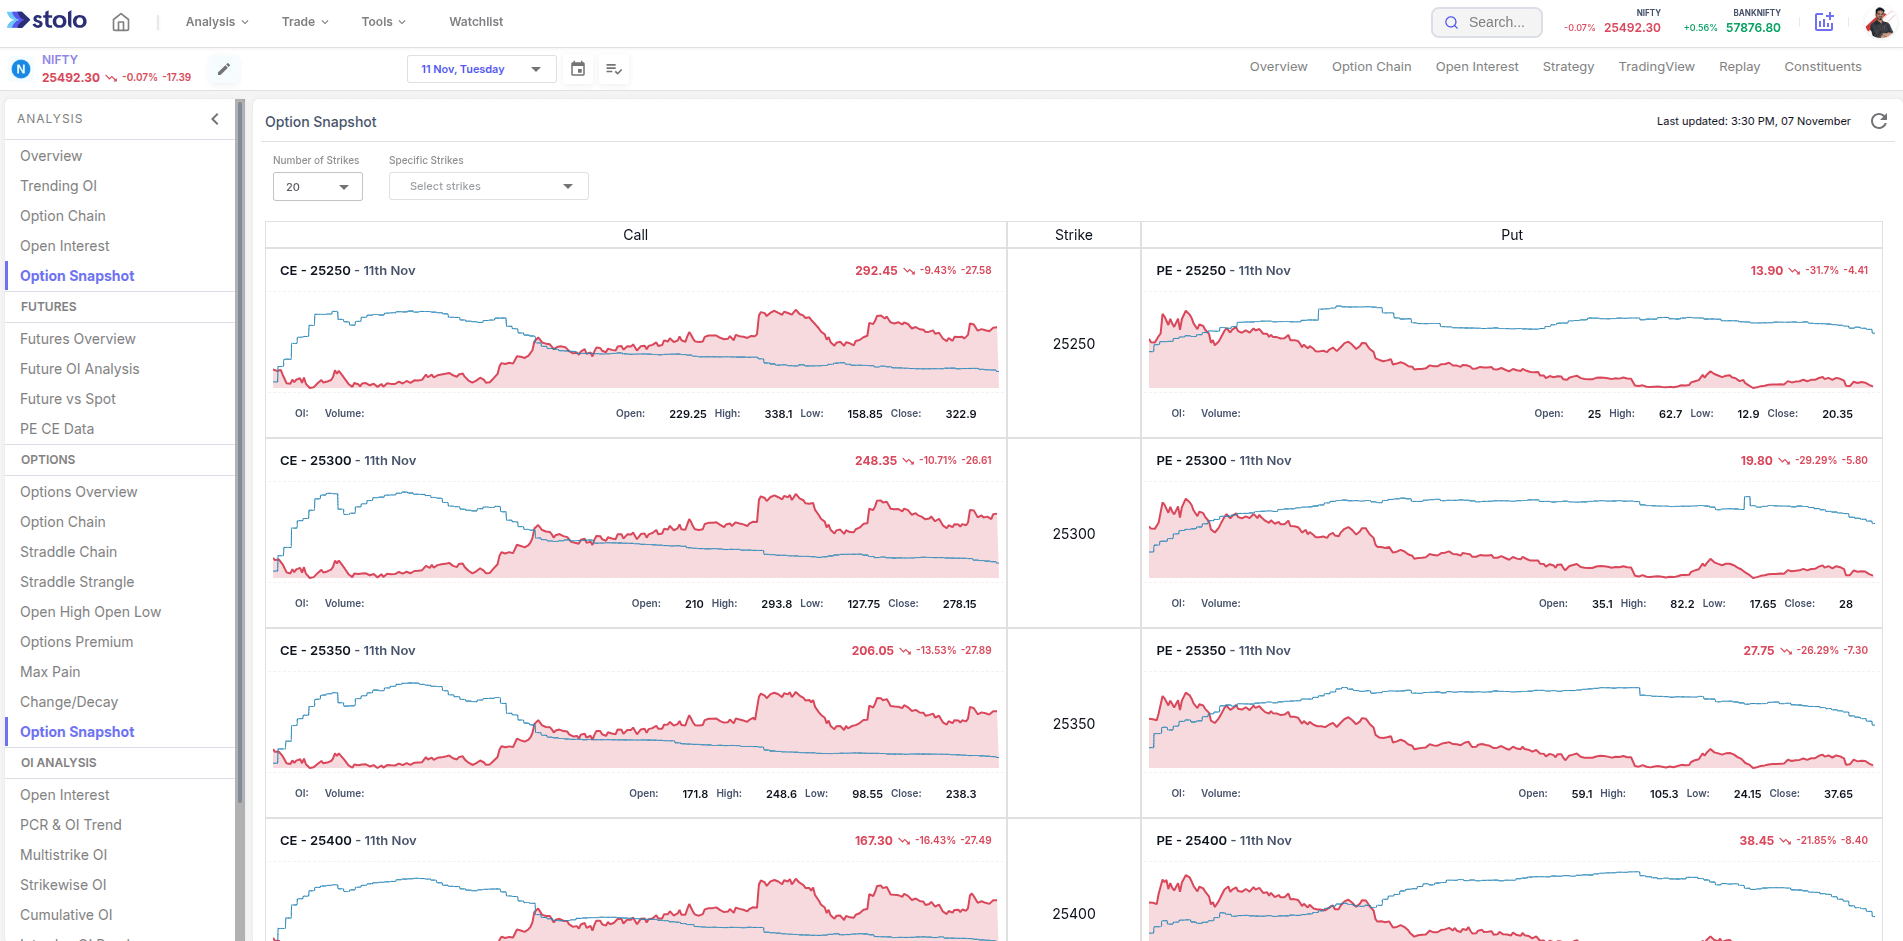
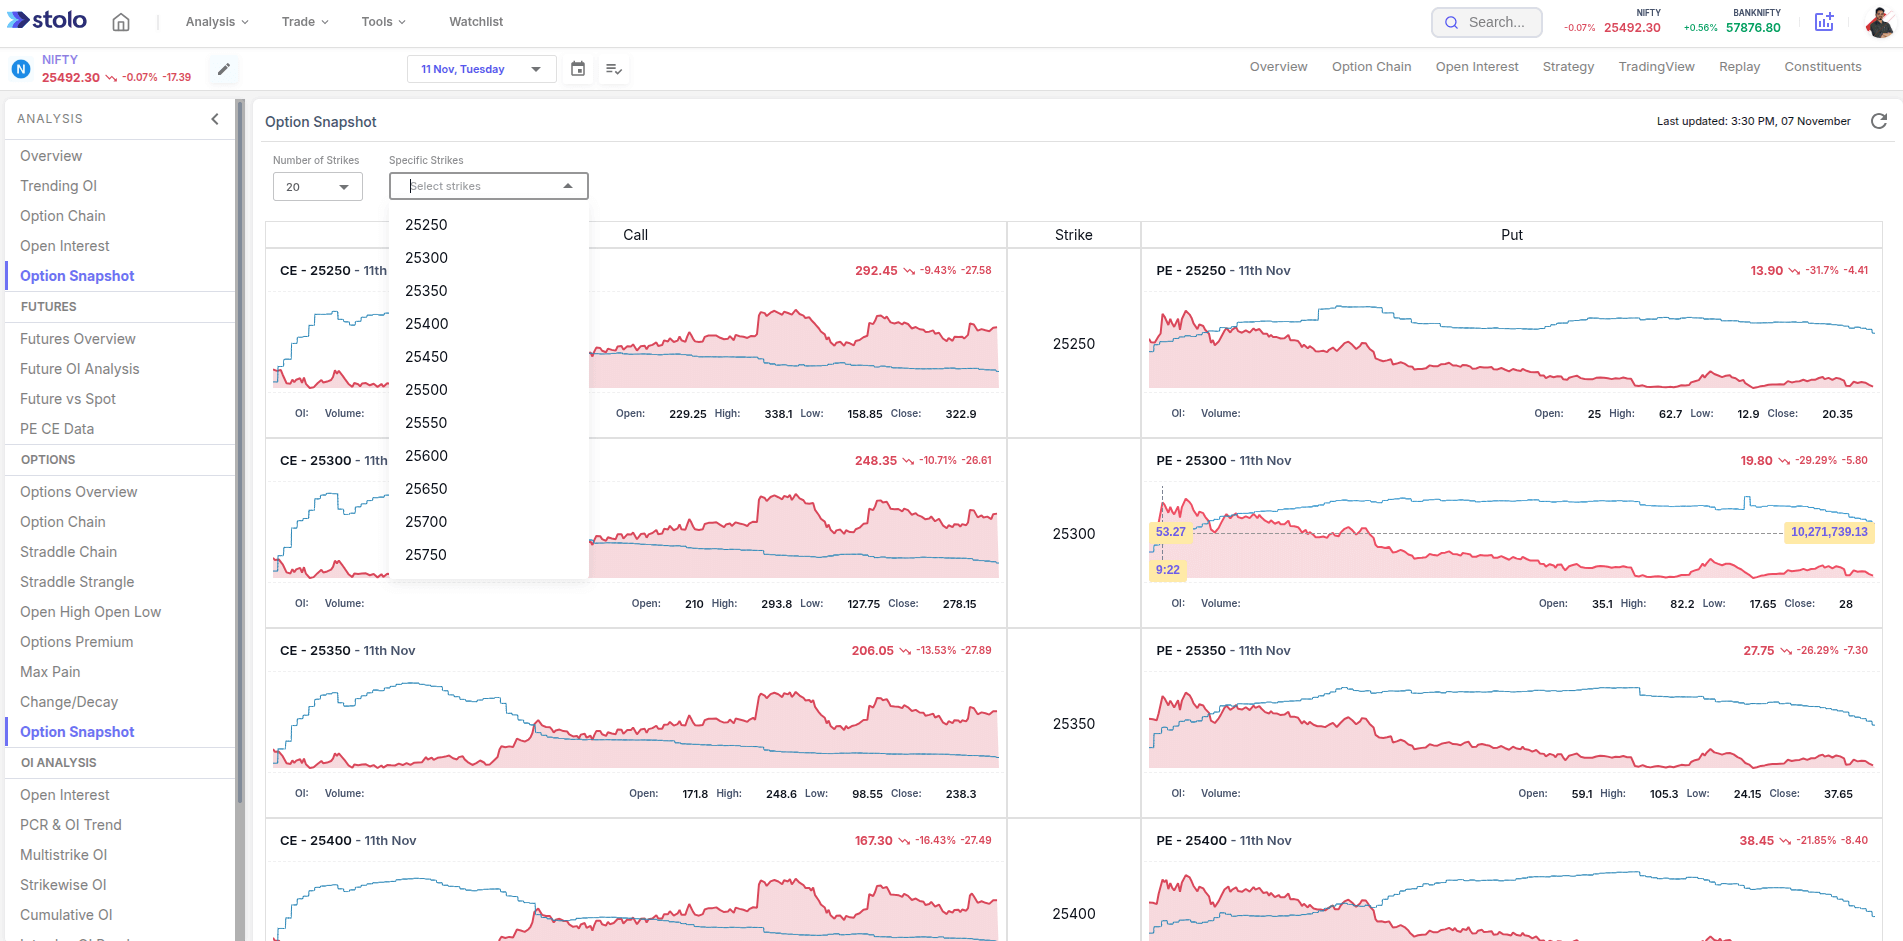
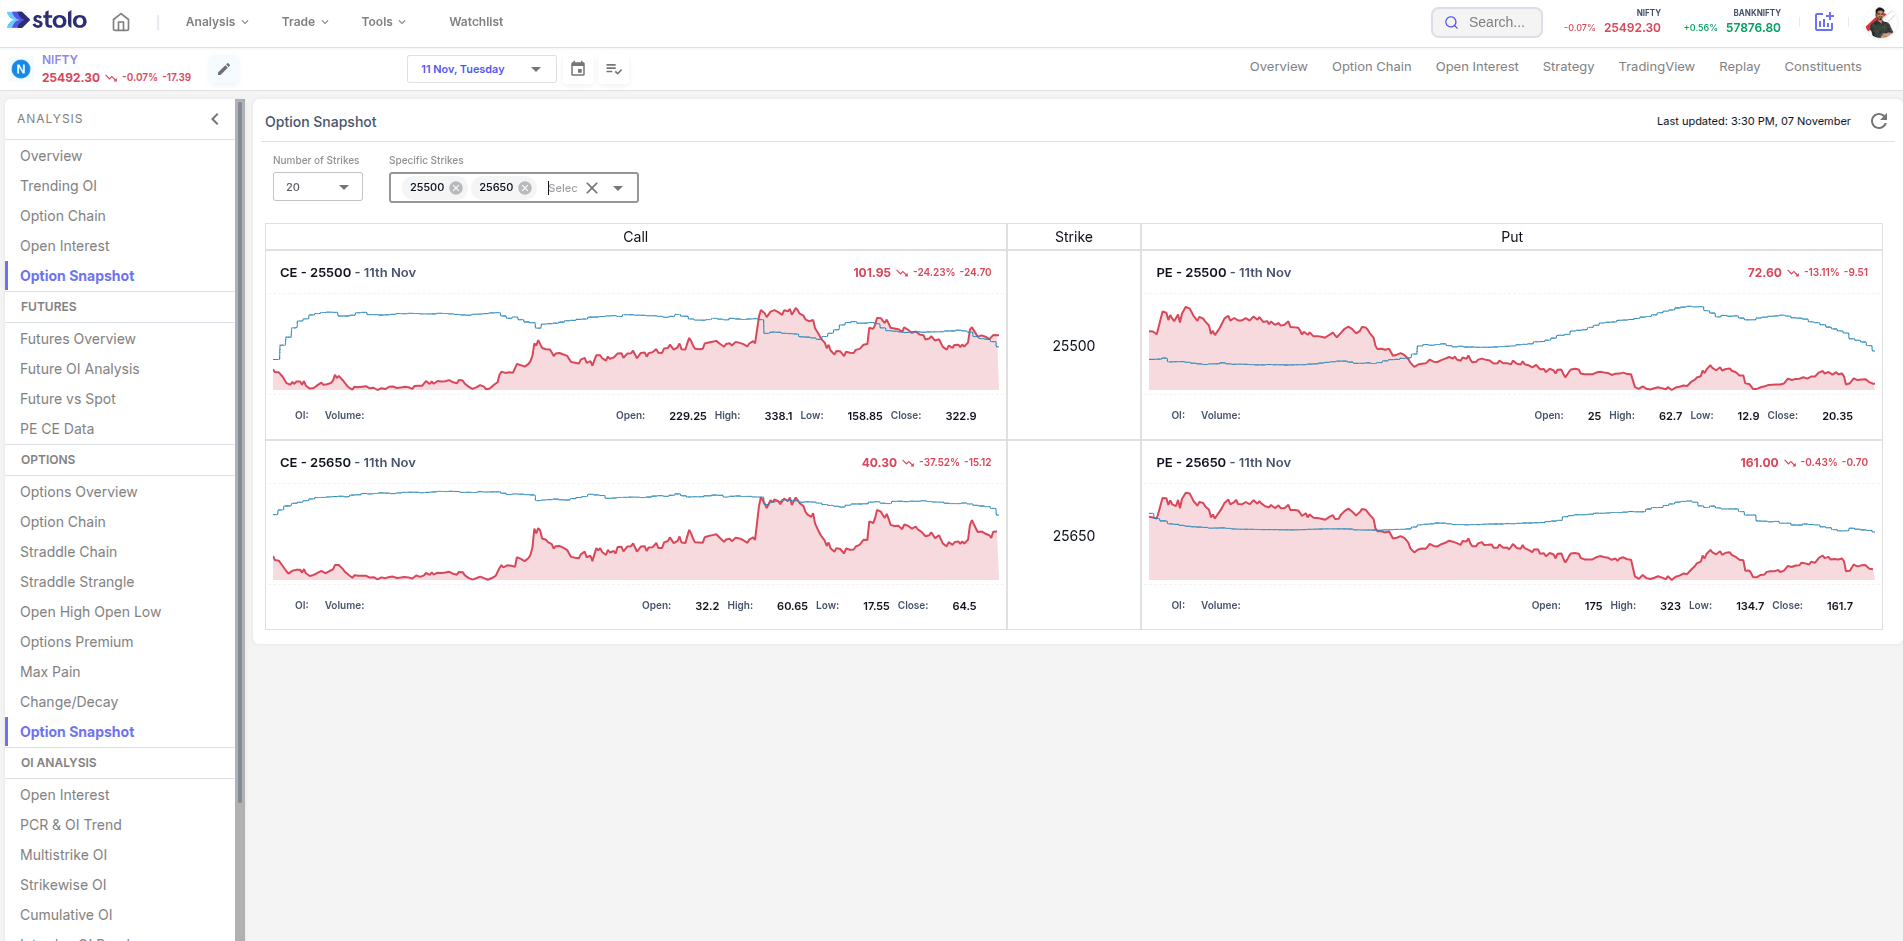
Stolo’s Option Snapshot Chart lets you select the number of strikes & an expiry for an instrument you want to analyze and instantly see Call (CE) and Put (PE) charts for the expiry set.
Each chart displays:
- OHLC data for price movement
- Overlay of Open Interest (OI)
- Color cues to differentiate CE and PE activity
How to use Options’ Snapshot
- Go to Analysis → Options -> Option Snapshot Chart
- Choose your instrument (e.g., NIFTY, BANKNIFTY, or any F&O stock)
- Select the expiry you want to analyze
- Choose the number of strikes (e.g., 5, 10, 15) to visualize
- View side-by-side CE & PE charts with OHLC and OI overlay
- Hover on the graph to see OI change, price movement.
Why use Options Snapshot
- View all strikes in one visual layout
- Combine price action (OHLC) and OI behavior seamlessly
- Identify key buildup/unwinding zones instantly
- Track market participation across strikes in real time
- Save time and reduce analysis fatigue
Frequently Asked Questions
What does the Option Snapshot Chart show?
How is Options Snapshot different from the Option Chain?
How many strikes can I view at once?
Does the data on the chart update live?
Can I use Options Snapshot for stocks as well as indices?
Ready to See Market Action Strike-by-Strike?
Open Stolo’s Option Snapshot Chart and visualize price & OI movement like never before.
Start with Trial Plan at just ₹299