Visualize Option Premium Change and Decay in Real Time with Stolo
Option prices tell two stories. One driven by market movement, the other by time.
Stolo’s Change / Decay Chart helps you separate those stories, so you know when premiums are moving because of price and when they’re shrinking because of time decay.
Challenges Retail Trader Face
Option traders often see premiums rise or fall but don’t know why. Is it because the underlying moved, or simply because time passed? Without a proper breakdown:
- You can't tell if IV (implied volatility) or theta caused the change.
- You can't measure how fast options are decaying across strikes.
- You might misread range-bound decay as directional strength.
Stolo’s Change / Decay view makes this distinction visual and immediate.
Introducing Stolo’s Change/Decay Analysis
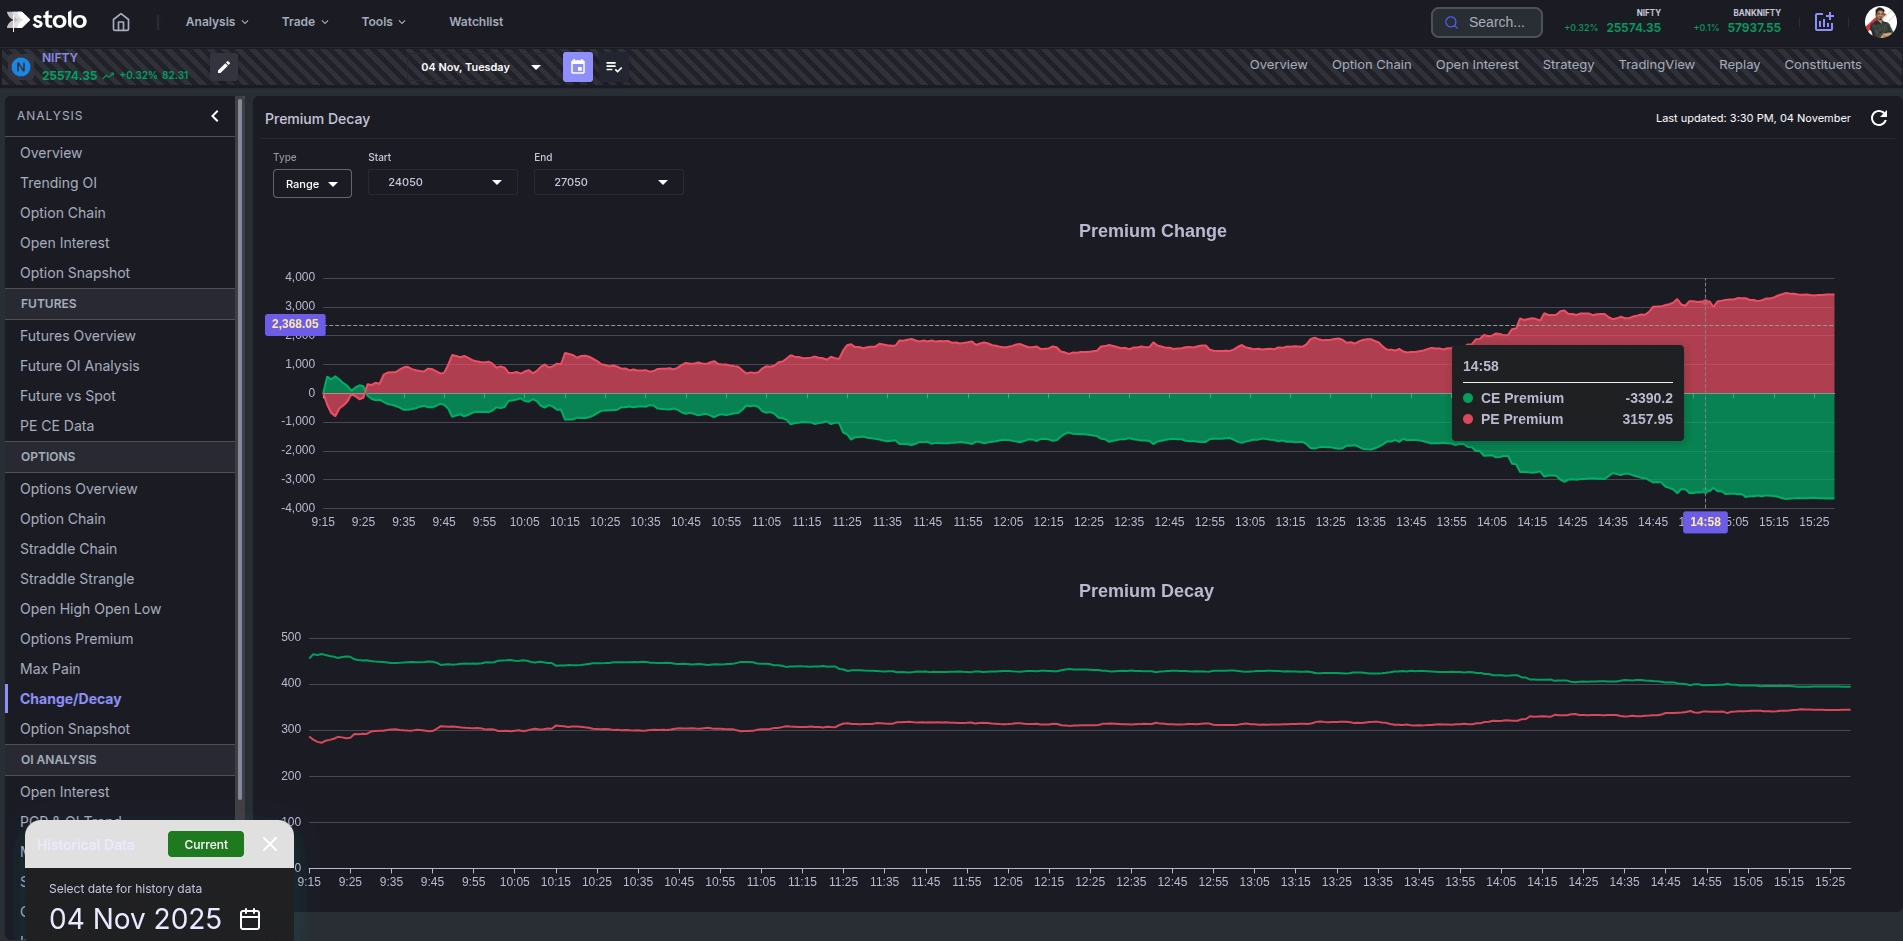
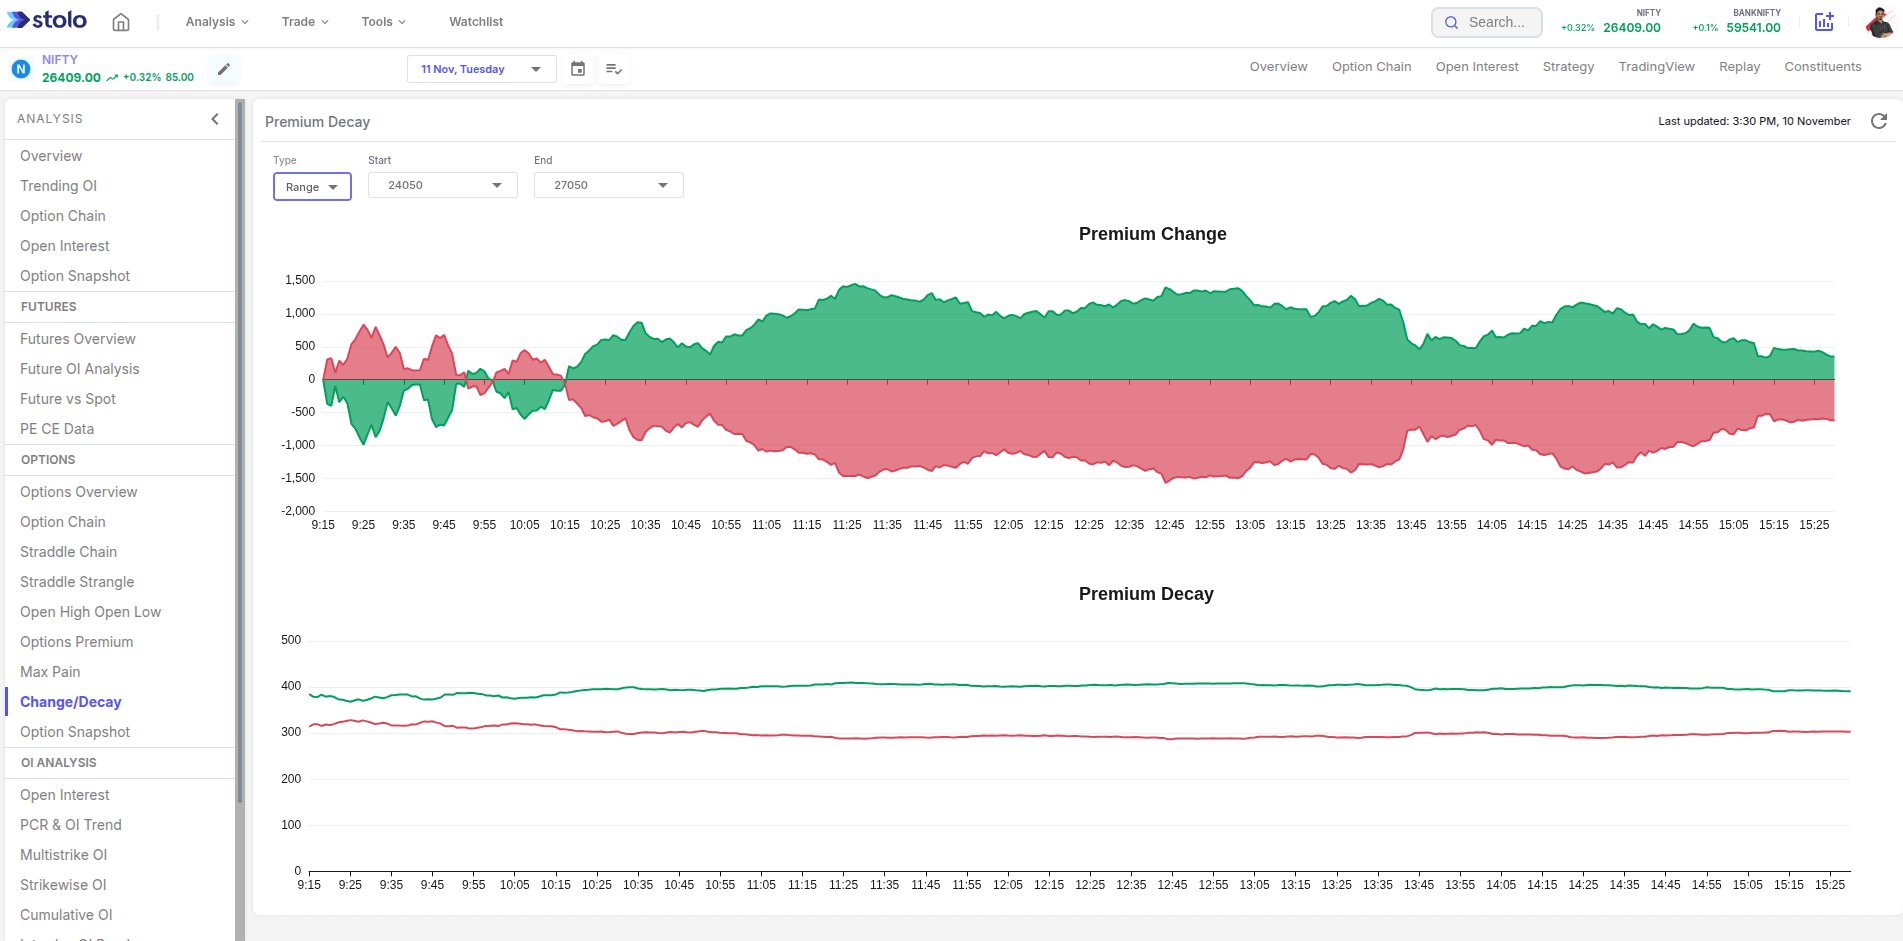
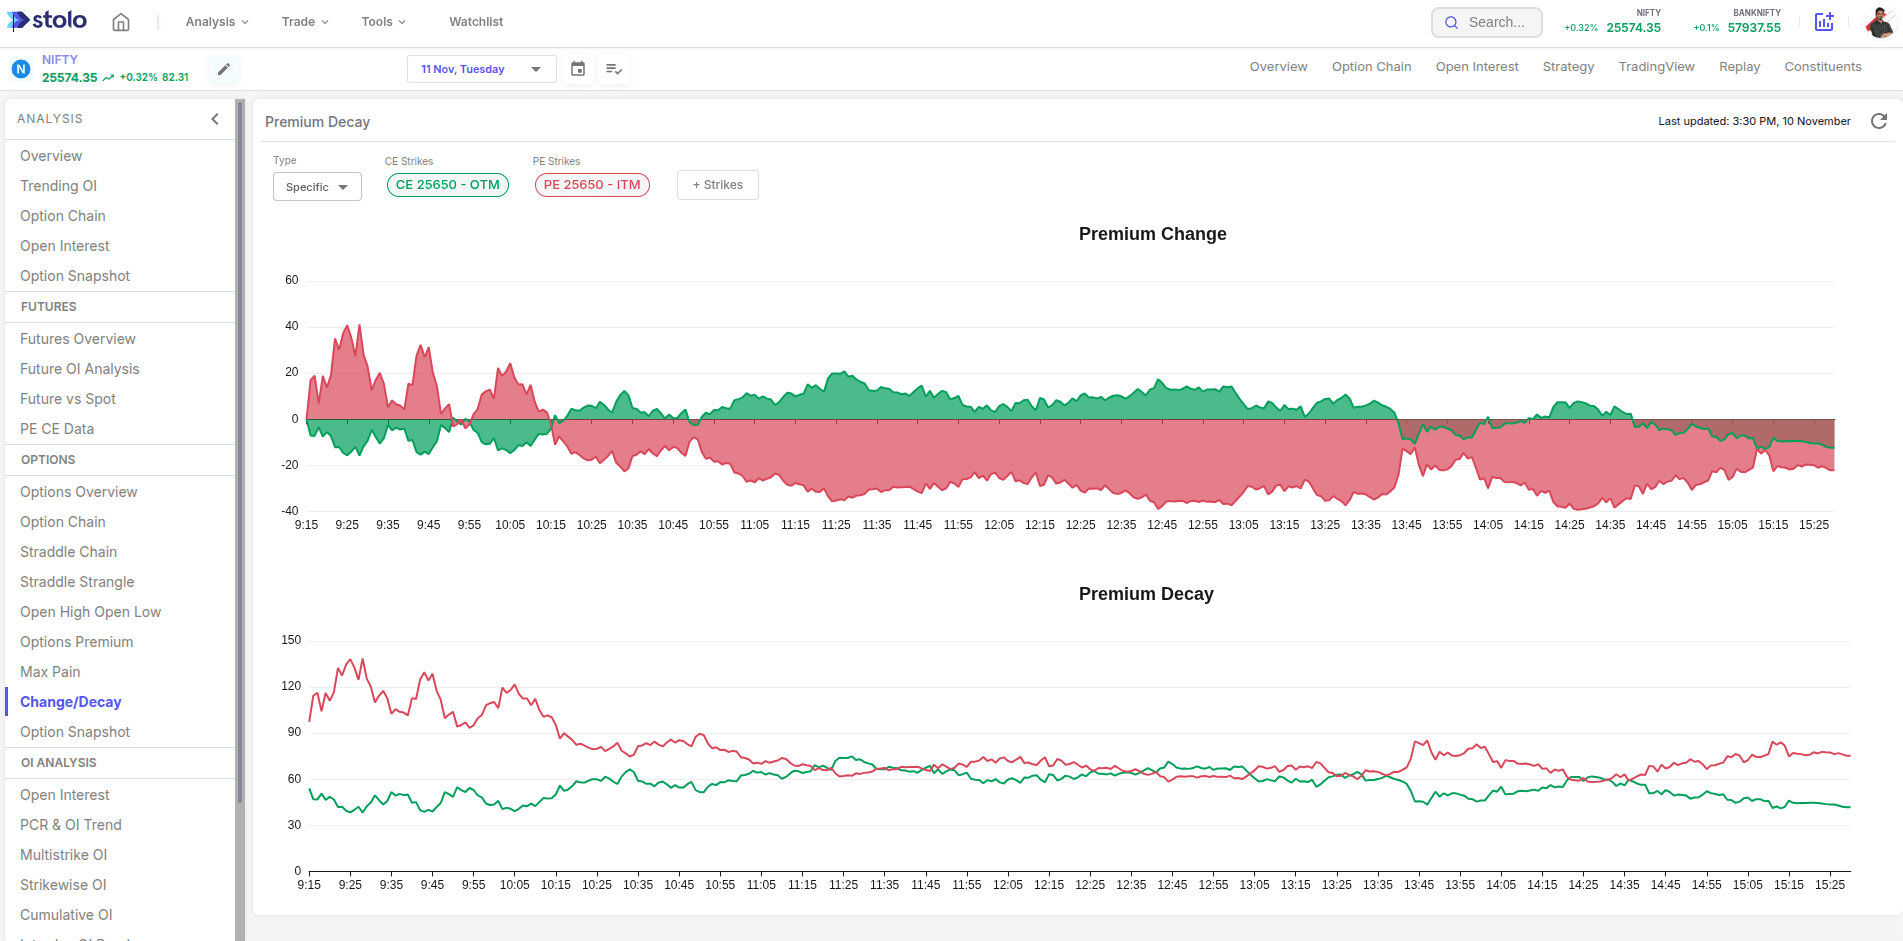
Stolo’s Change/Decay analysis charts shows you how premium for a selected strike(s) (PE & CE) have changed & decayed throughout the intraday in the same screen,
What you’ll see:
- Change View: Highlights intraday rise / fall in option price.
- Decay View: Shows natural erosion (time or IV cooling).
How to access Stolo’s Change/Decay Analysis?
- Go to Analysis → Change / Decay
- Select your instrument (NIFTY, BANKNIFTY, or stock) and expiry
- Choose if you wish to see the change/decay for selected strikes or for range of strikes
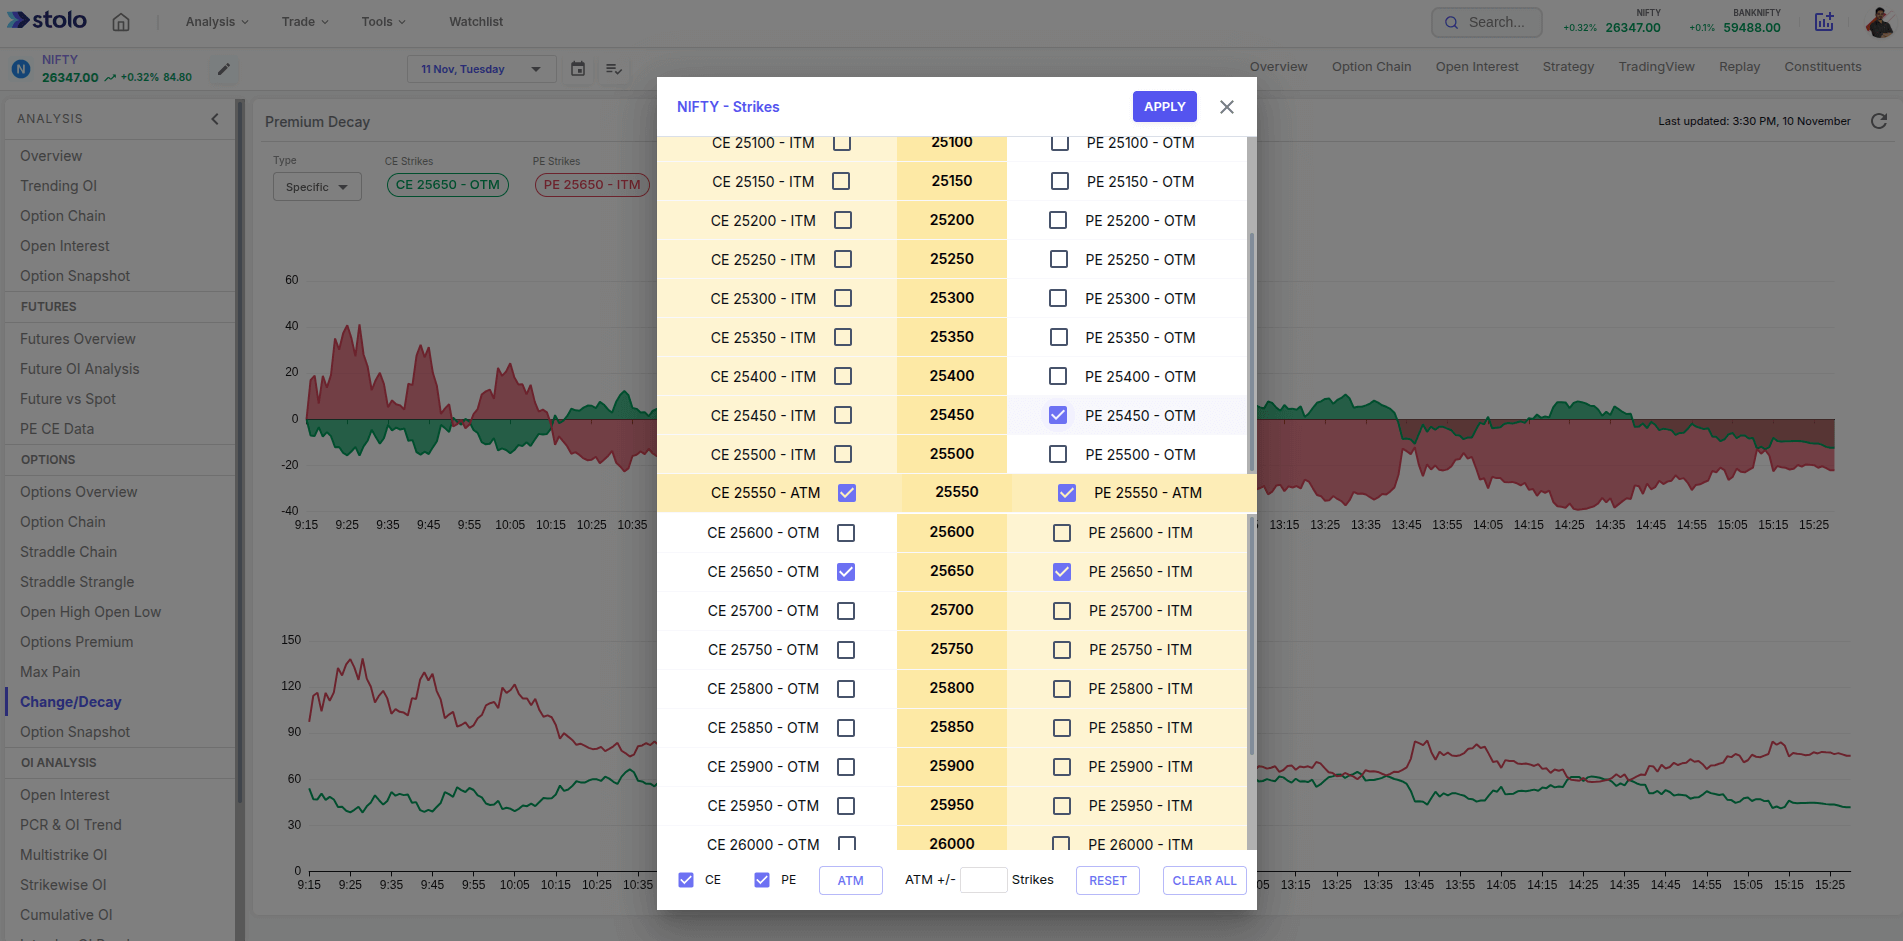
- If you choose a selected strike, you can add pairs of strikes from ATM/ ITM from the selection popup and view the changes in charts. If it's a range selection, you can choose the range bound strikes.
- You may hover on charts to see additional information
Frequently Asked Questions
What does Change / Decay mean in options?
How does Stolo calculate Decay?
Can I view both Calls and Puts together?
Does the Change/Decay chart get updated live?
Can I see change/decay trends for future expiries?
See What’s Driving Premiums. Is it the movement or decay?
Open the Change / Decay chart on Stolo and get instant clarity on why option prices behave the way they do.
Start with Trial Plan at just ₹299