Spot Early Market Bias with Stolo’s Open High Open Low View
Stolo’s Open High Open Low Chart helps you instantly see which stocks or indices are showing that momentum so you can align with the trend & not fight it. Every trader knows the first few minutes of the market-open set the tone for the day & yet this data gets buried amidst many other charts and tables.
Without a dedicated view:
- You can't quickly spot Open = High or Open = Low patterns.
- You waste time filtering symbols manually.
- You miss early momentum entries or fade signals.
Stolo’s Open High Open Low chart solves this by laying out this information in a neatly formatted table with clear indications.
Introducing Stolo’s Open High Open Low Chart
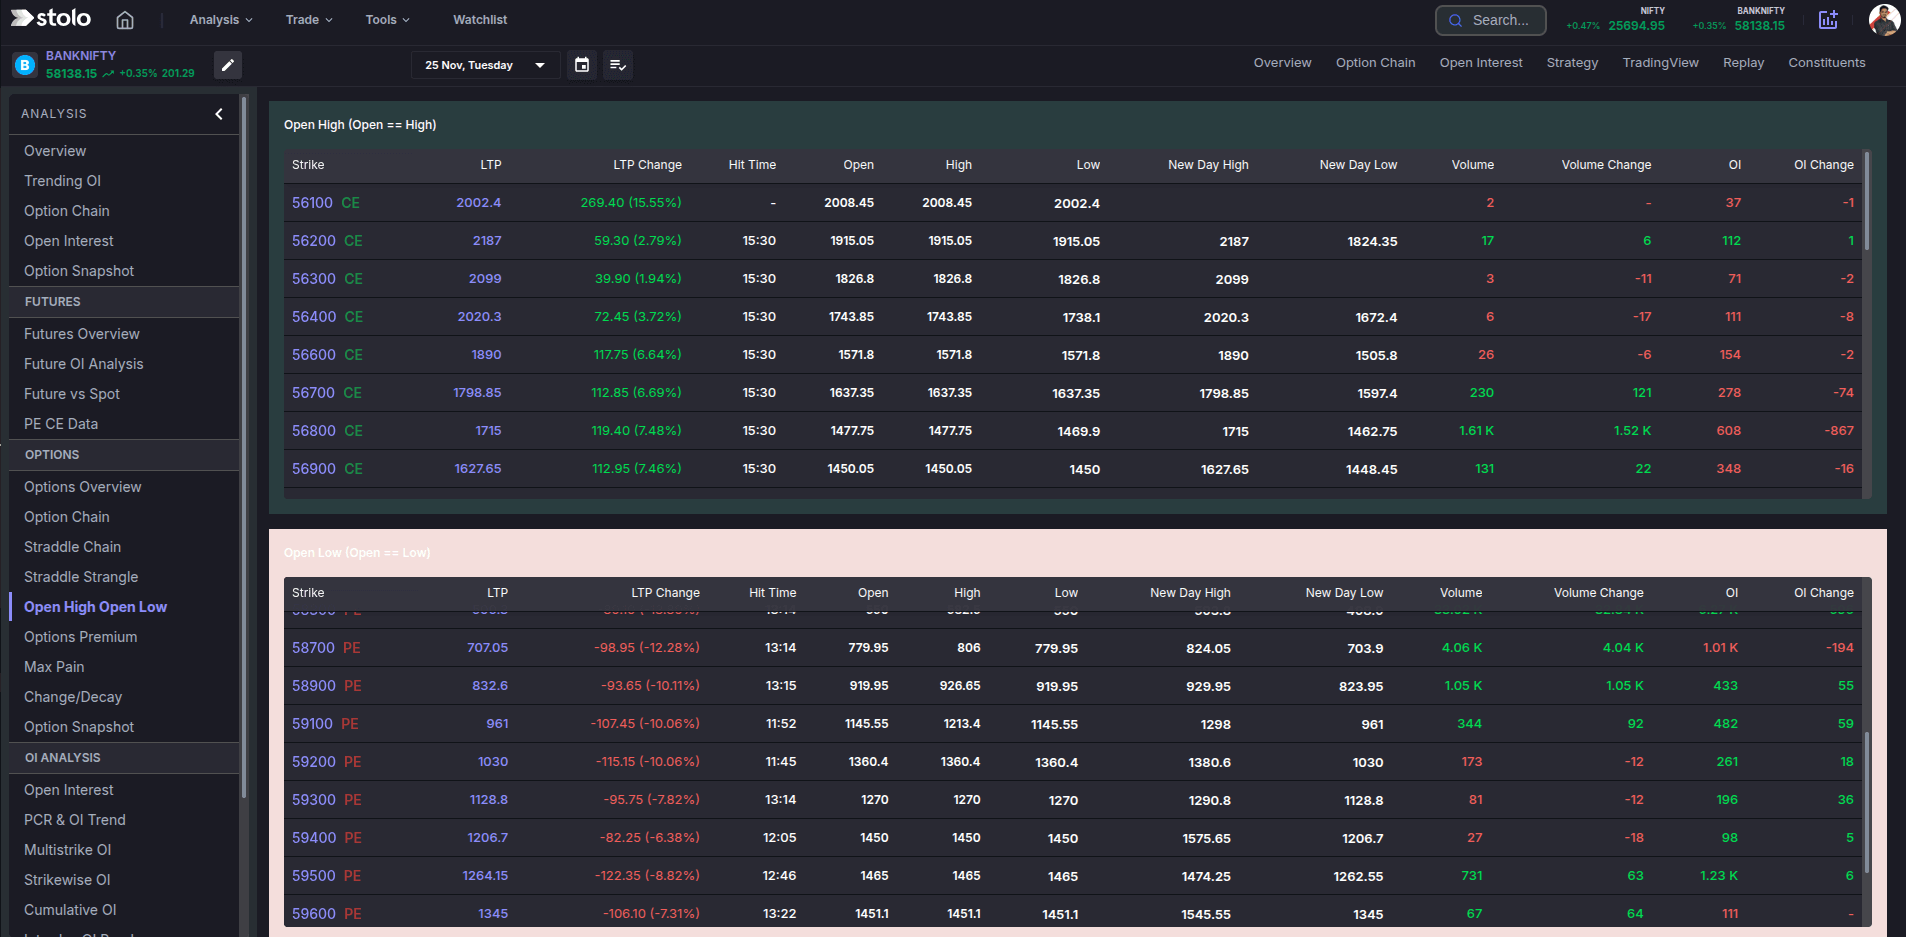
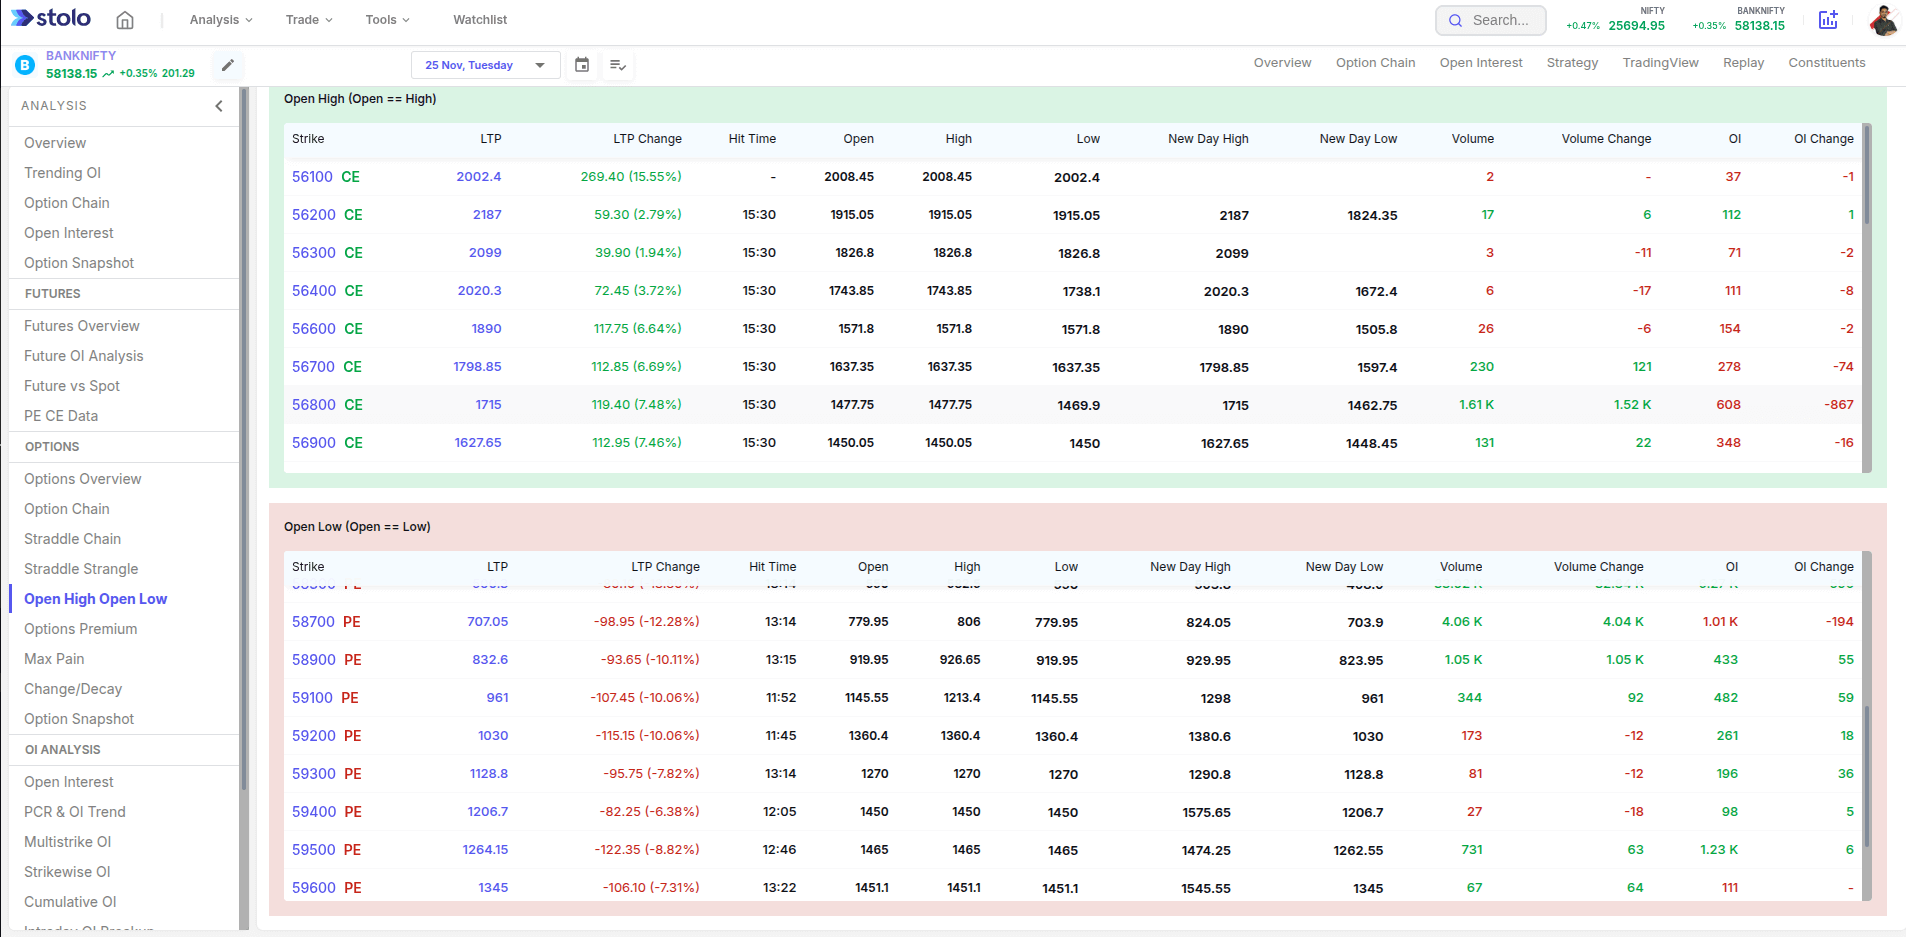
The Open High Open Low feature scans all available indices and stocks and highlights those where the opening price is also the day’s high (bearish) or the day’s low (bullish).
It visually marks these levels and tracks subsequent price behavior through the session.
What you can see:
- Real-time list of symbols forming Open = High (red) or Open = Low (green).
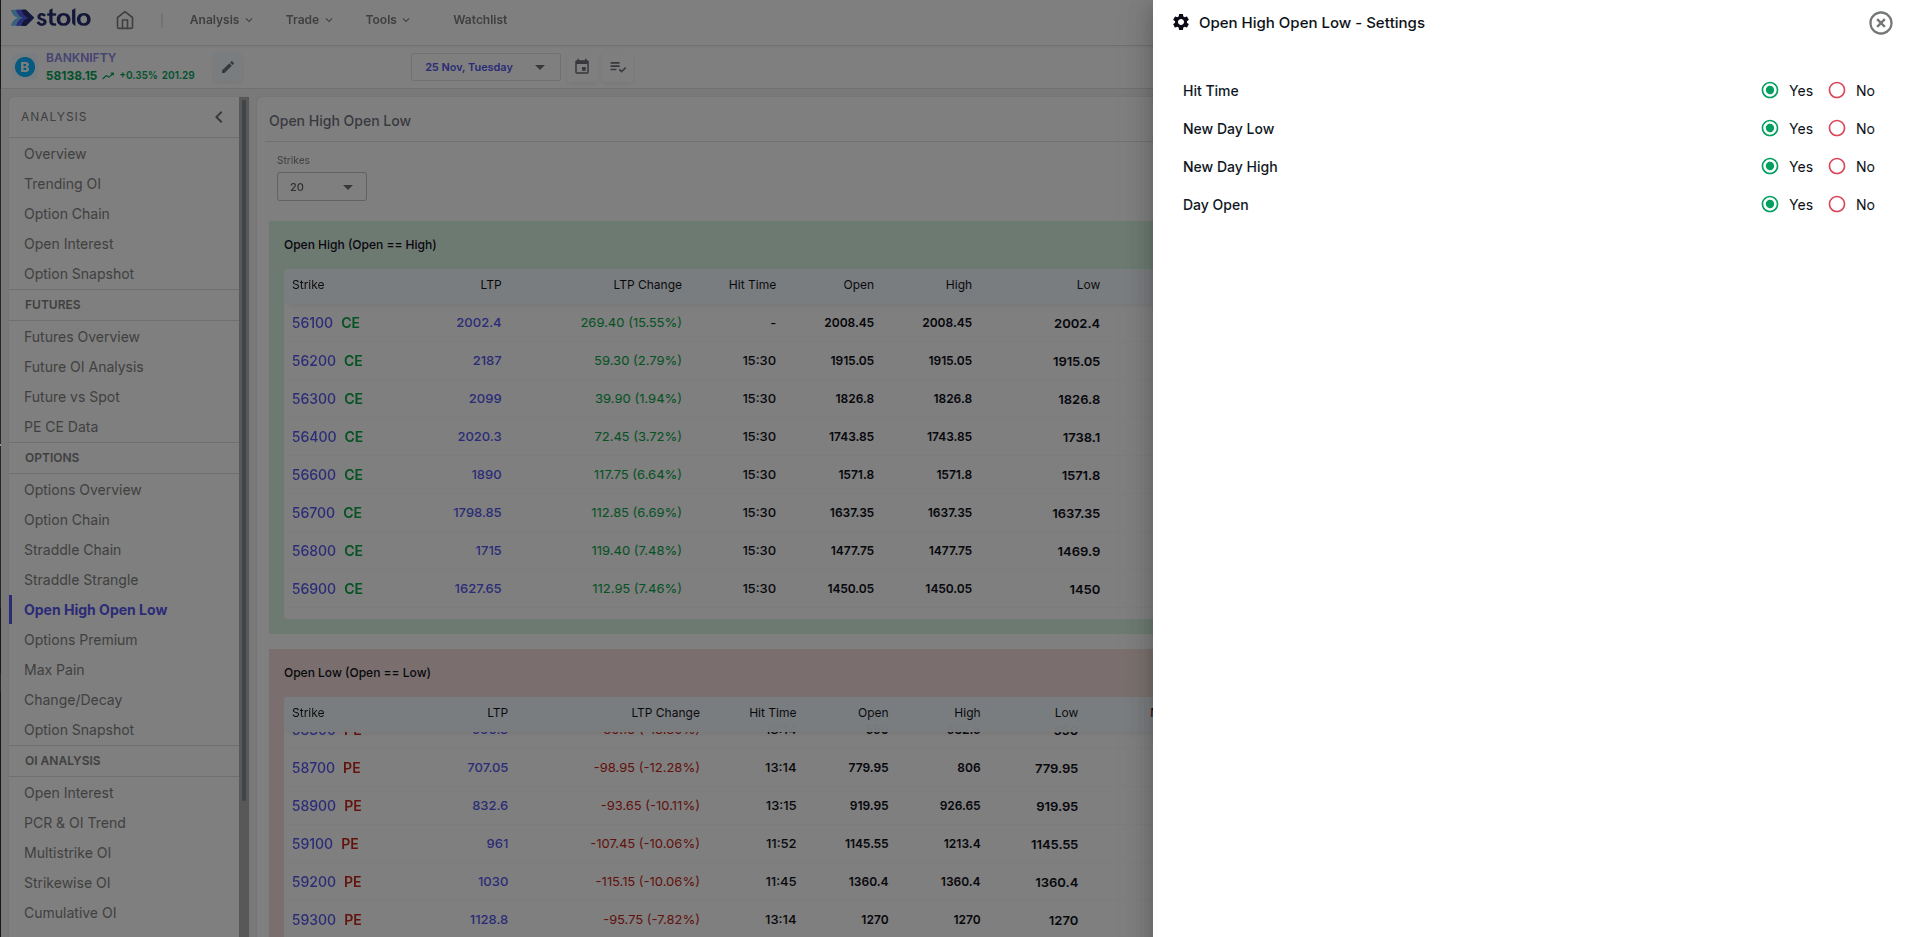
- It also shows Day Open, Day Low, New Day High, LTP, Hit Time with a color indicator for O=L or O=H
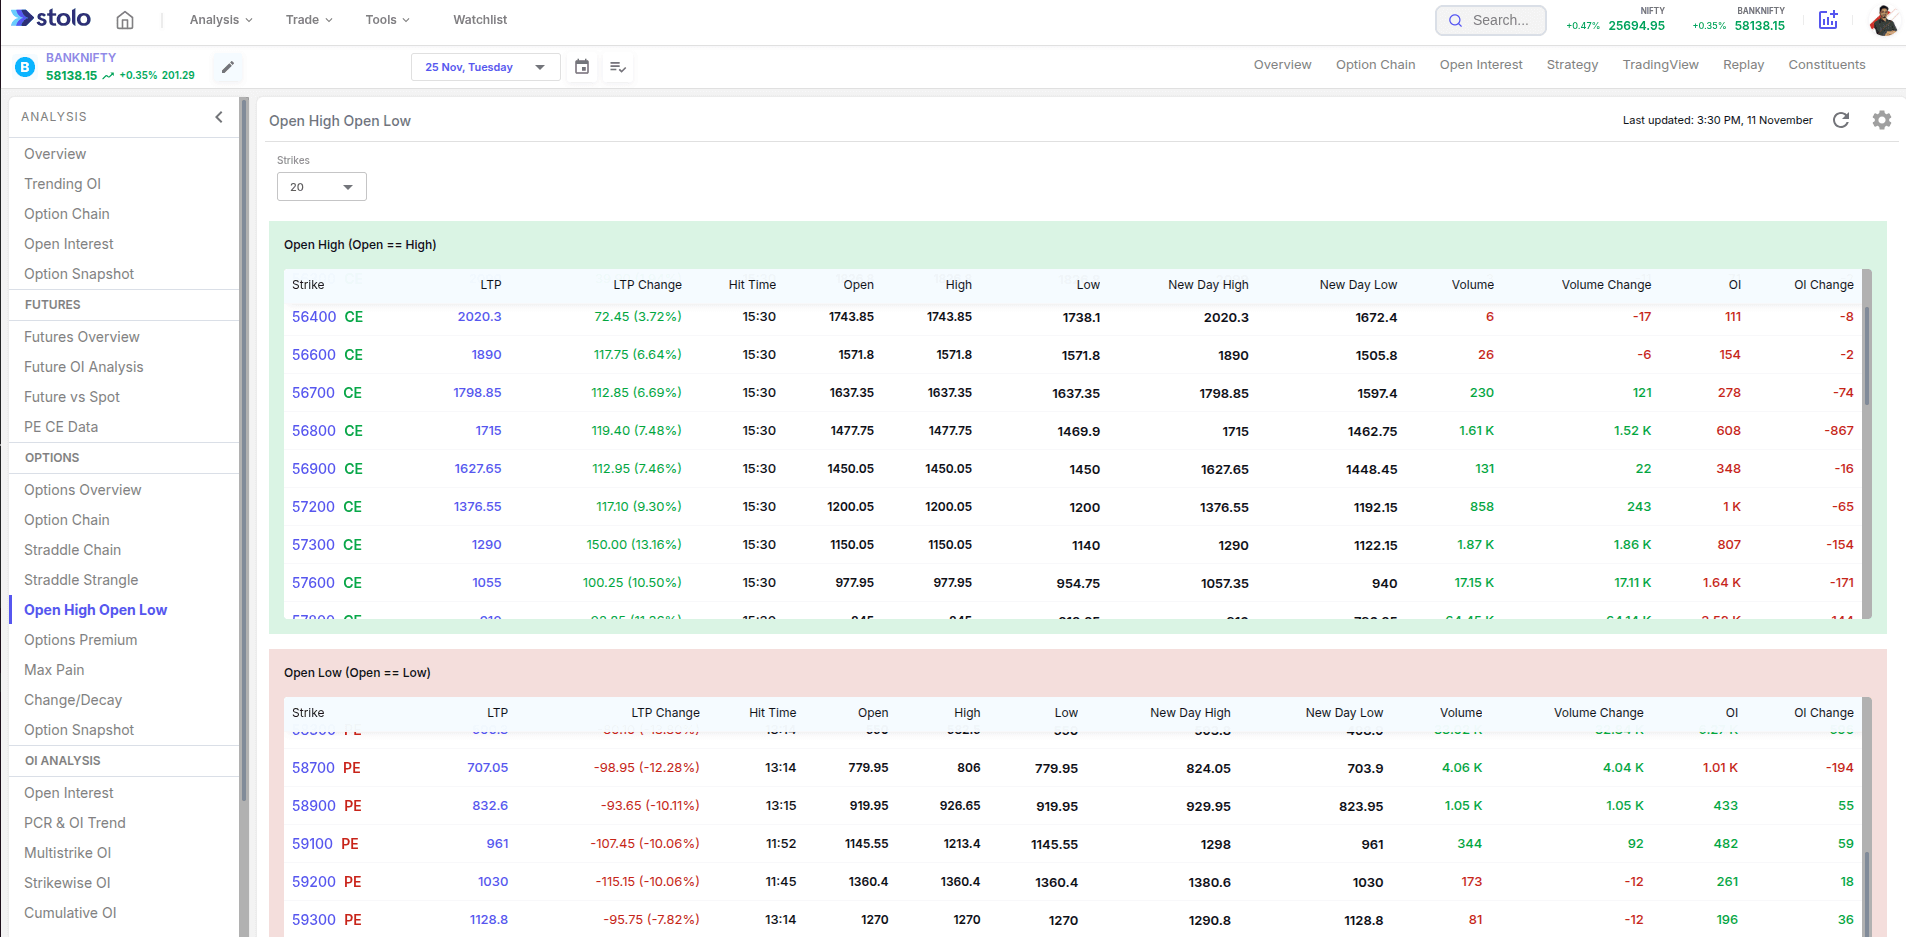
- You can customise the table to show columns that are necessary for you to see
- You can choose the number of strikes and select the condition (either Open=High or Open=Low) to see the data in the table.
In one glance, you can identify trend starters and faders without running complex screeners.
How to Access Open High Open Low in Stolo
- Go to Analysis → Options → Open High Open Low
- Choose your segment (NIFTY50, BANKNIFTY stocks, F&O list, etc.) and expiry
- Choose number of strikes you wish to see
- View the table showing all strikes flagged as OH = High or OH = Low as applicable
Frequently Asked Questions
What is Open High Open Low (OHOL)?
How does Stolo detect OHOL patterns?
Does the pattern update intraday?
Ready to Catch Momentum as It Starts?
Open Stolo’s Open High Open Low view and see where buyers or sellers took control right from the open.
Start with Trial Plan at just ₹299