See Where the Money Is Flowing — With Stolo’s Sector Analysis
Markets move in themes. Some sectors lead, others quietly roll over.
Stolo’s Sectors Analysis view gives you a clean snapshot of which sectors are green, which are red, and how the breadth looks under the hood—all in one screen.
Challenges Traders Face
Most traders look only at indices like NIFTY or BANKNIFTY and miss the story underneath:
- Which sectors are actually driving the move?
- Is the rally broad-based or just a handful of stocks?
- Are defensive sectors outperforming while cyclicals bleed?
On typical platforms, you need to jump across multiple pages to piece this together.
Stolo solves this with a single Sectors Analysis view that shows breadth, performance distribution, and live sector charts together.
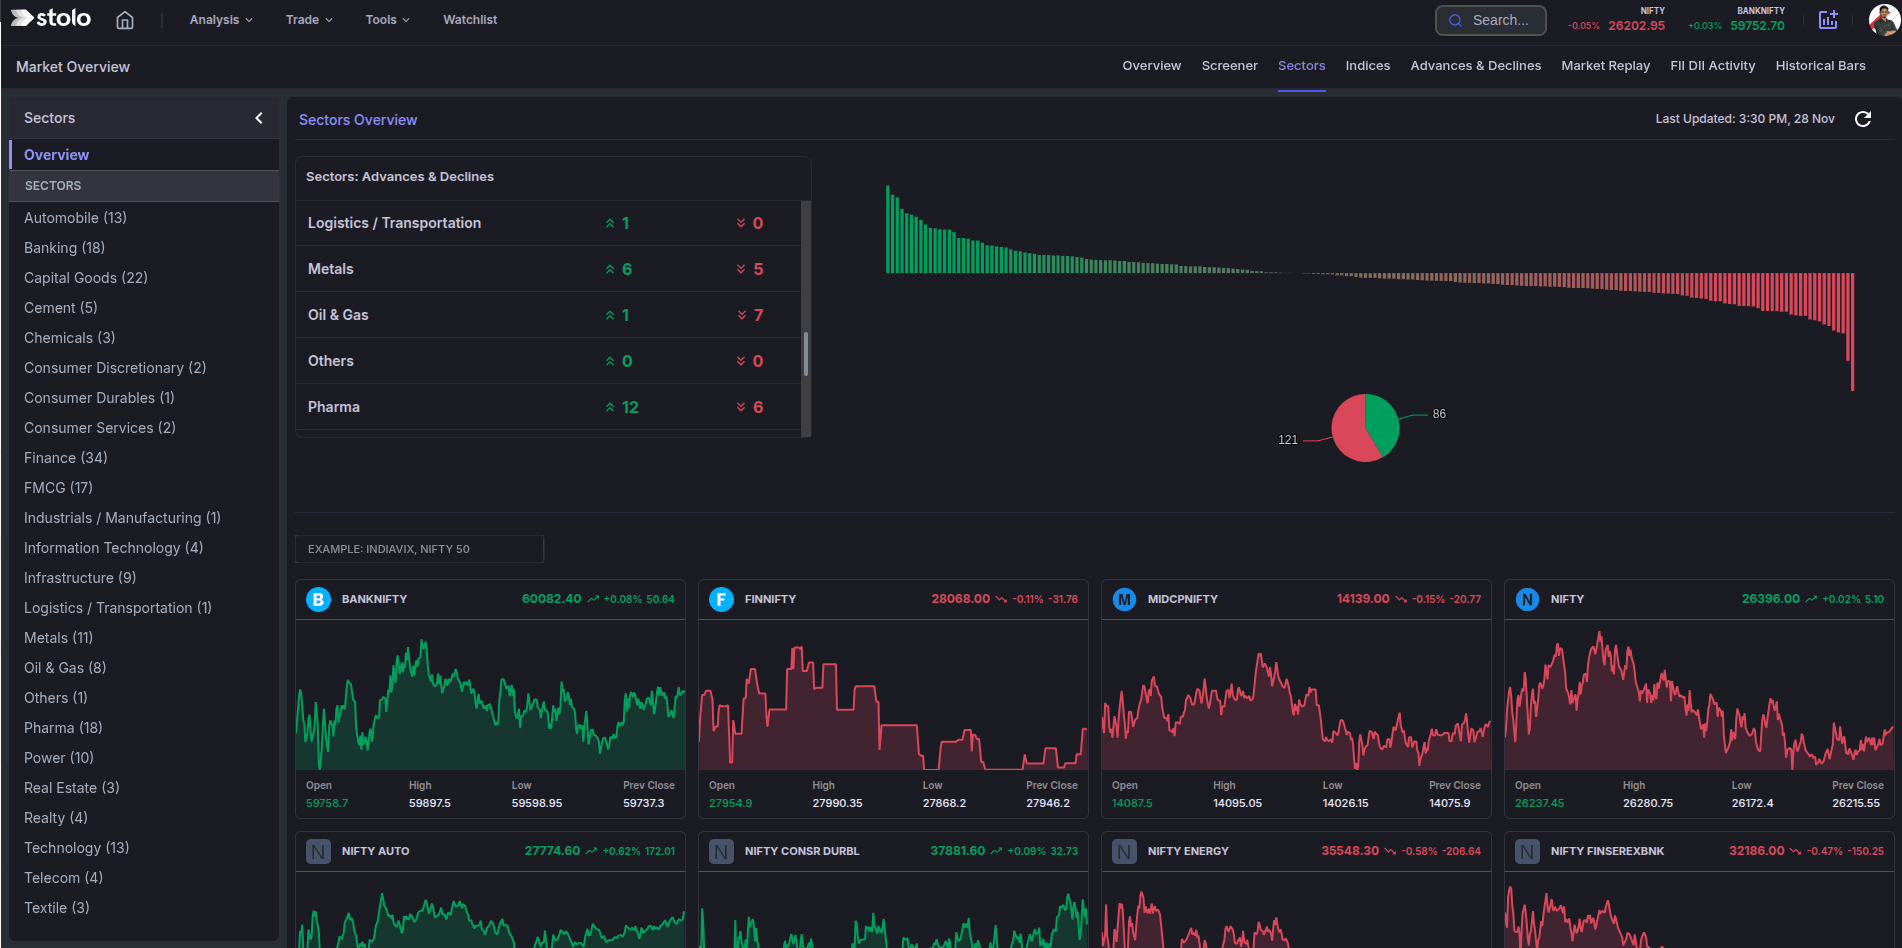
Meet Sector Analysis — Your Market Breadth & Rotation Radar
The Sectors Analysis view in Stolo combines:
Sectors Advances & Declines panel
- For each sector: number of advancing vs declining stocks.
- Quick green/red arrows for instant bias.
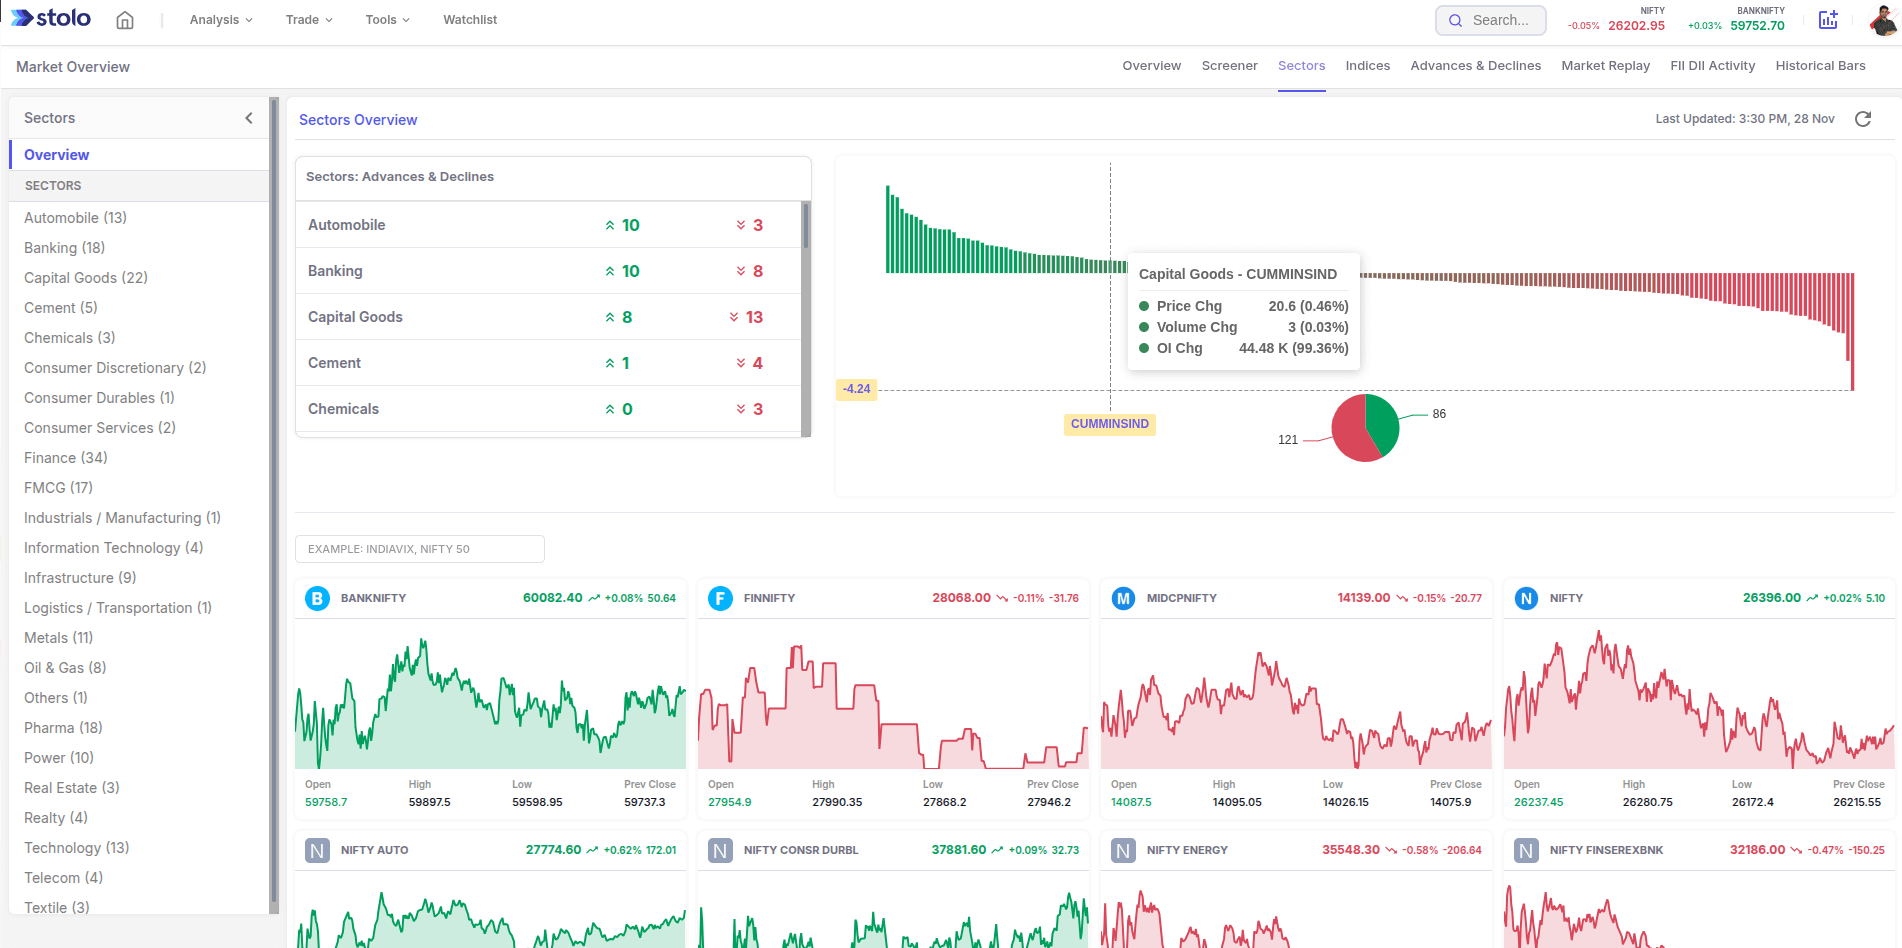
Sector Performance Distribution Chart
- Bar chart showing how all sectors are distributed from strongest to weakest.
- Red–green split visual to understand overall market breadth.
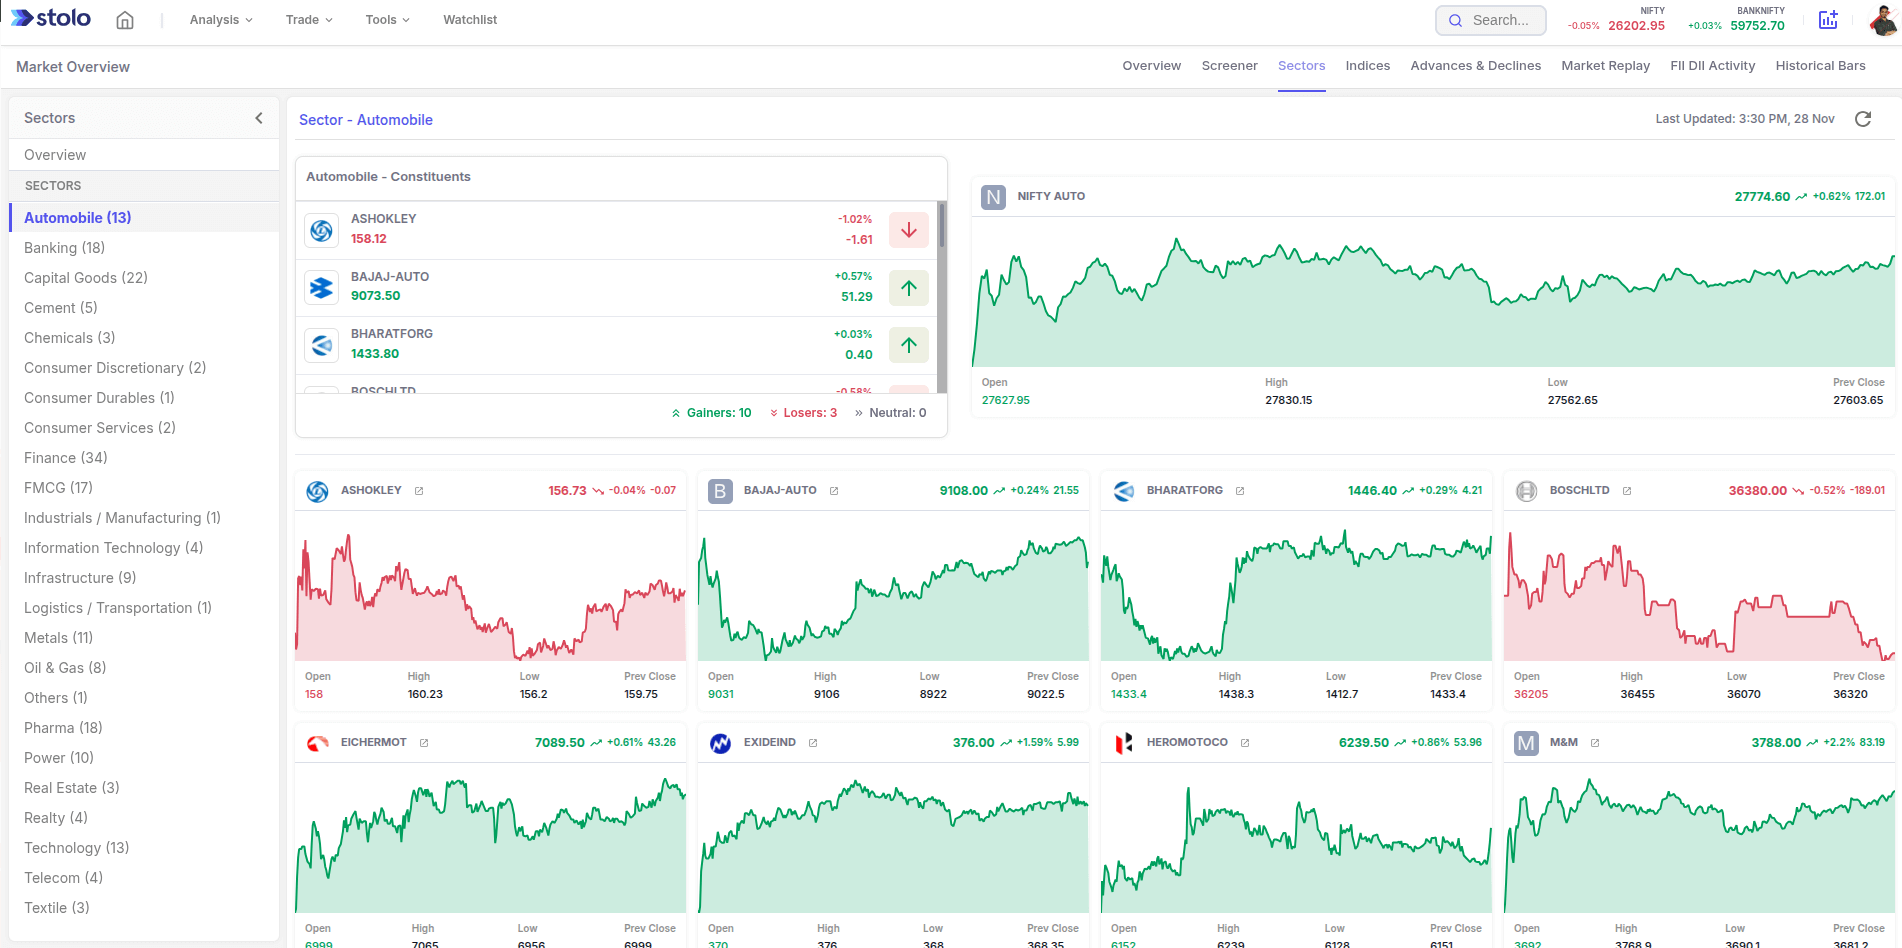
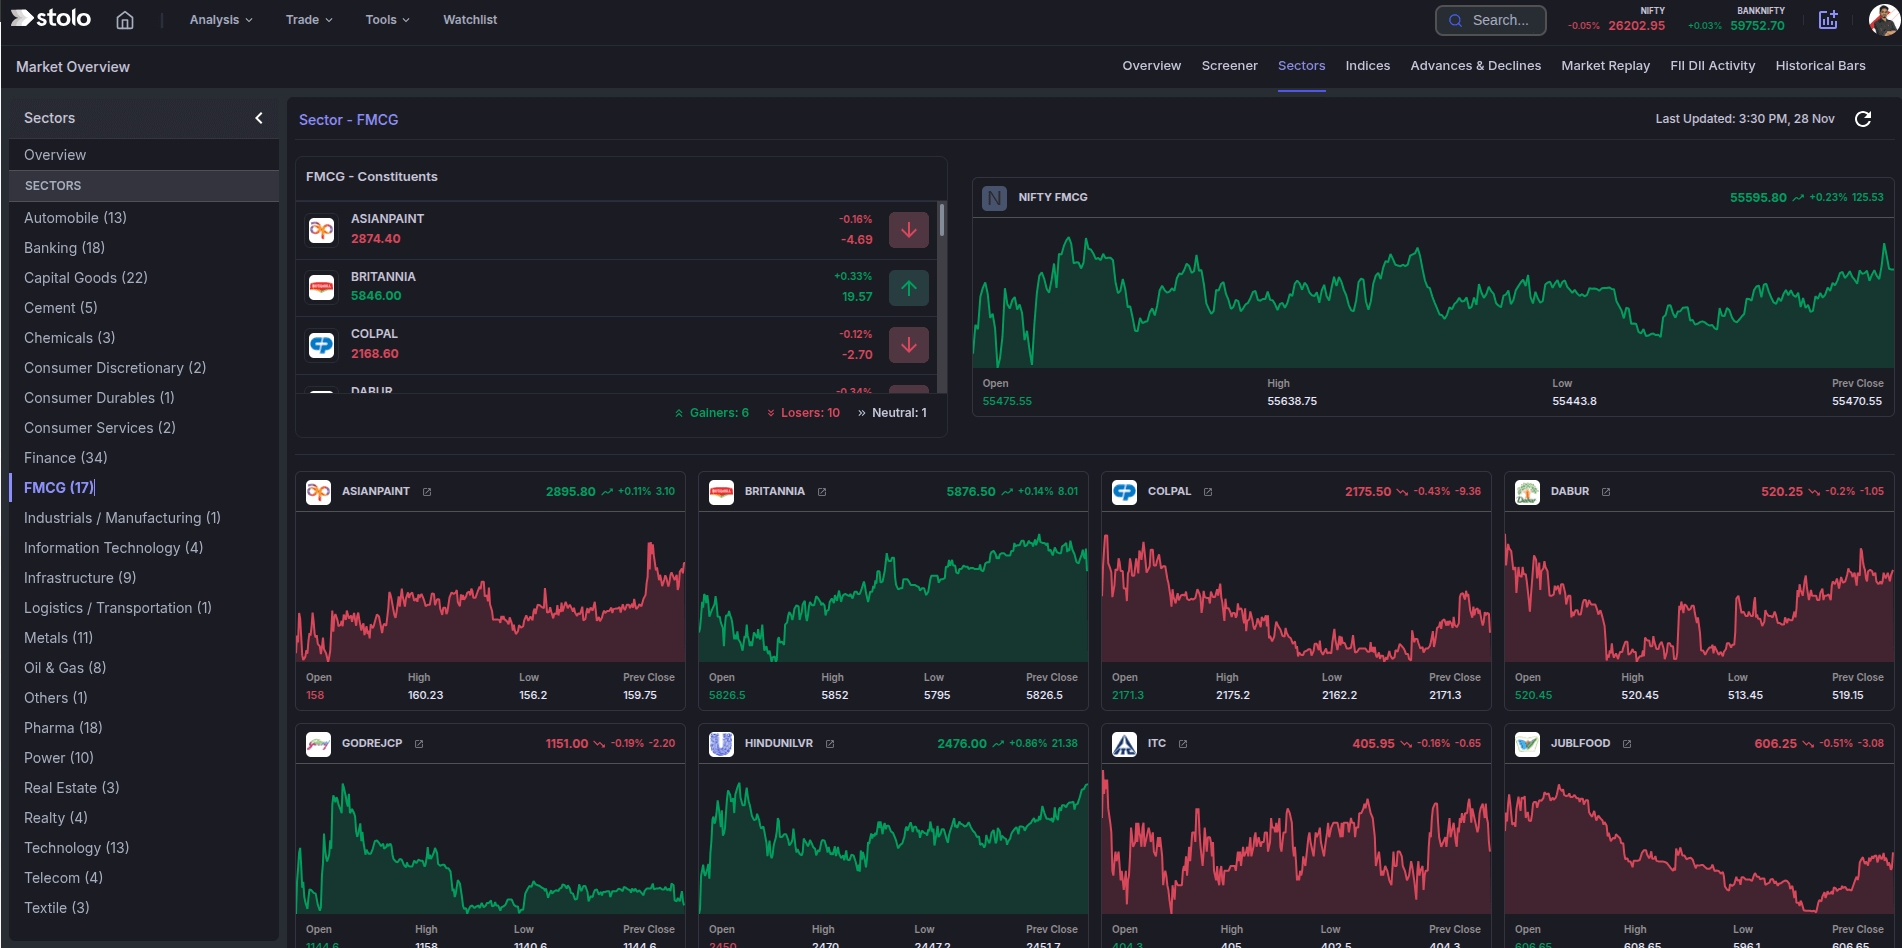
Live Sector Index Cards
- Cards for indices like BANKNIFTY, FINNIFTY, MIDCPNIFTY, NIFTY, AUTO, ENERGY, etc.
- Each card shows intraday mini-chart, LTP, % change, and OHLC (Open, High, Low, Prev Close).
Sector List & Navigation (left panel)
- Full list of sectors (Banking, IT, FMCG, Metals, Pharma, etc.).
- Click a sector to drill into its indices or individual stocks in other Stolo views (like Market Screener).
In one glance, you know which sectors are in charge and whether the market move is strong or weak internally.
How to Use Sectors Analysis in Stolo
- Log in to Stolo's using your subscribed account
- Navigate to main menu and spot Sectors Analysis under "Market Sentiment" section
- On the left panel, browse through the sector list (Banking, IT, FMCG, Metals, etc.)
- In sectors overview section, watch:
- Advance vs declines in each sector
- Total counts of advancing and declining stocks
- Check the distribution bar chart & red/green donut/pie to gauge whether the day is:
- Broadly bullish
- Broadly bearish
- Mixed/sideways
- Scroll through the sector index cards at the bottom to see live intraday charts and OHLC for each major sector index.
Benefits of Using Sector Analysis
- Understand market breadth beyond the headline index
- Spot sector rotation and leadership early
- Quickly see which themes to focus on for the day
- Align trades with strong sectors, avoid weak pockets
- Use as a starting point before drilling into stock-level screeners
Frequently Asked Questions
What is shown in the Sectors Overview panel?
What does the big bar chart represent?
What are the sector index cards at the bottom?
How often does the Sectors Analysis view update?
Ready to Trade with the Strongest Sectors?
Start your day on Stolo’s Sector Analysis view, then drill into Market Screener and options analytics for high-conviction setups.
Start with Trial Plan at just ₹299