Trade Analysis - Overall
Trade analysis in Stolo has many offerings under it. The overall tab gives you a summary of your trade performance for a selected day across various metrics.
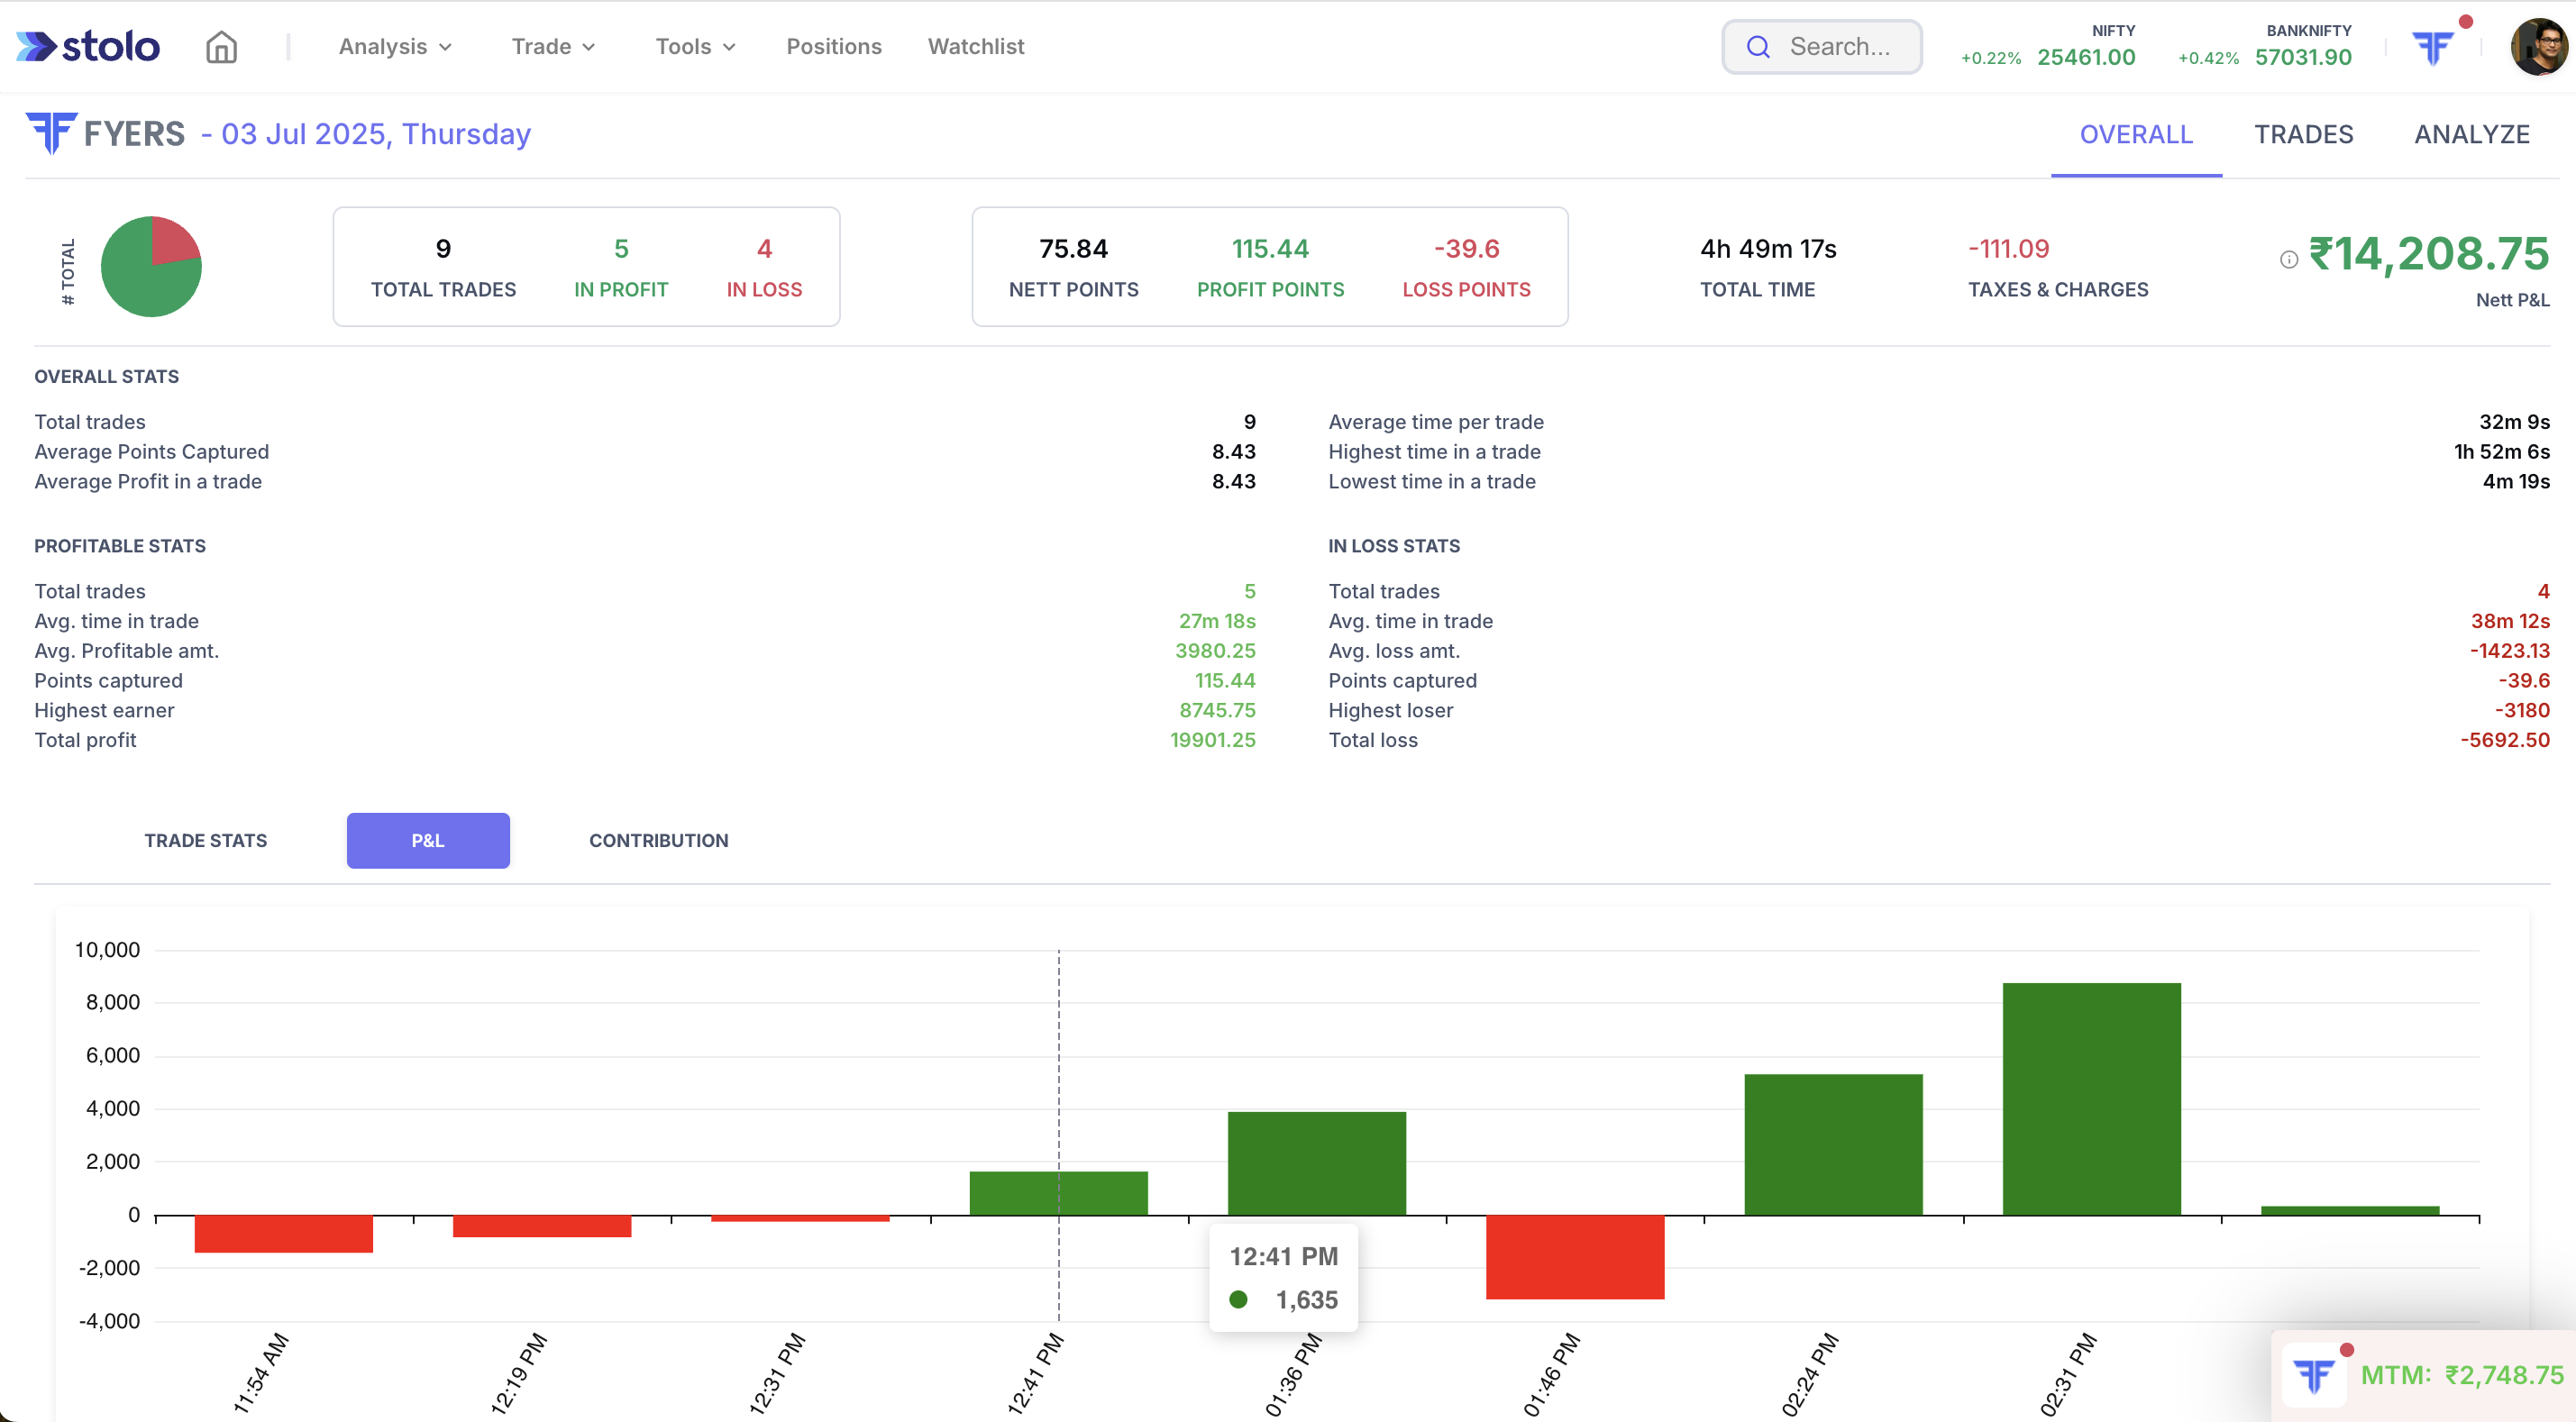
Trade Analysis - Overall Tab
As you can see, the page with the overall tab selected is divided into two sections, one with data and one with a graphical view that tells a lot about your trade performance.
Data Metrics Shows and Meaning
Overall Stats
This section will indicate information relevant to your trade time and points captured which is highly important to know what kind of trader you are.
Details shown here include metrics like total trades done in the day, average points captured and average profit in a trade, average time per trade, highest time in trade and so on.
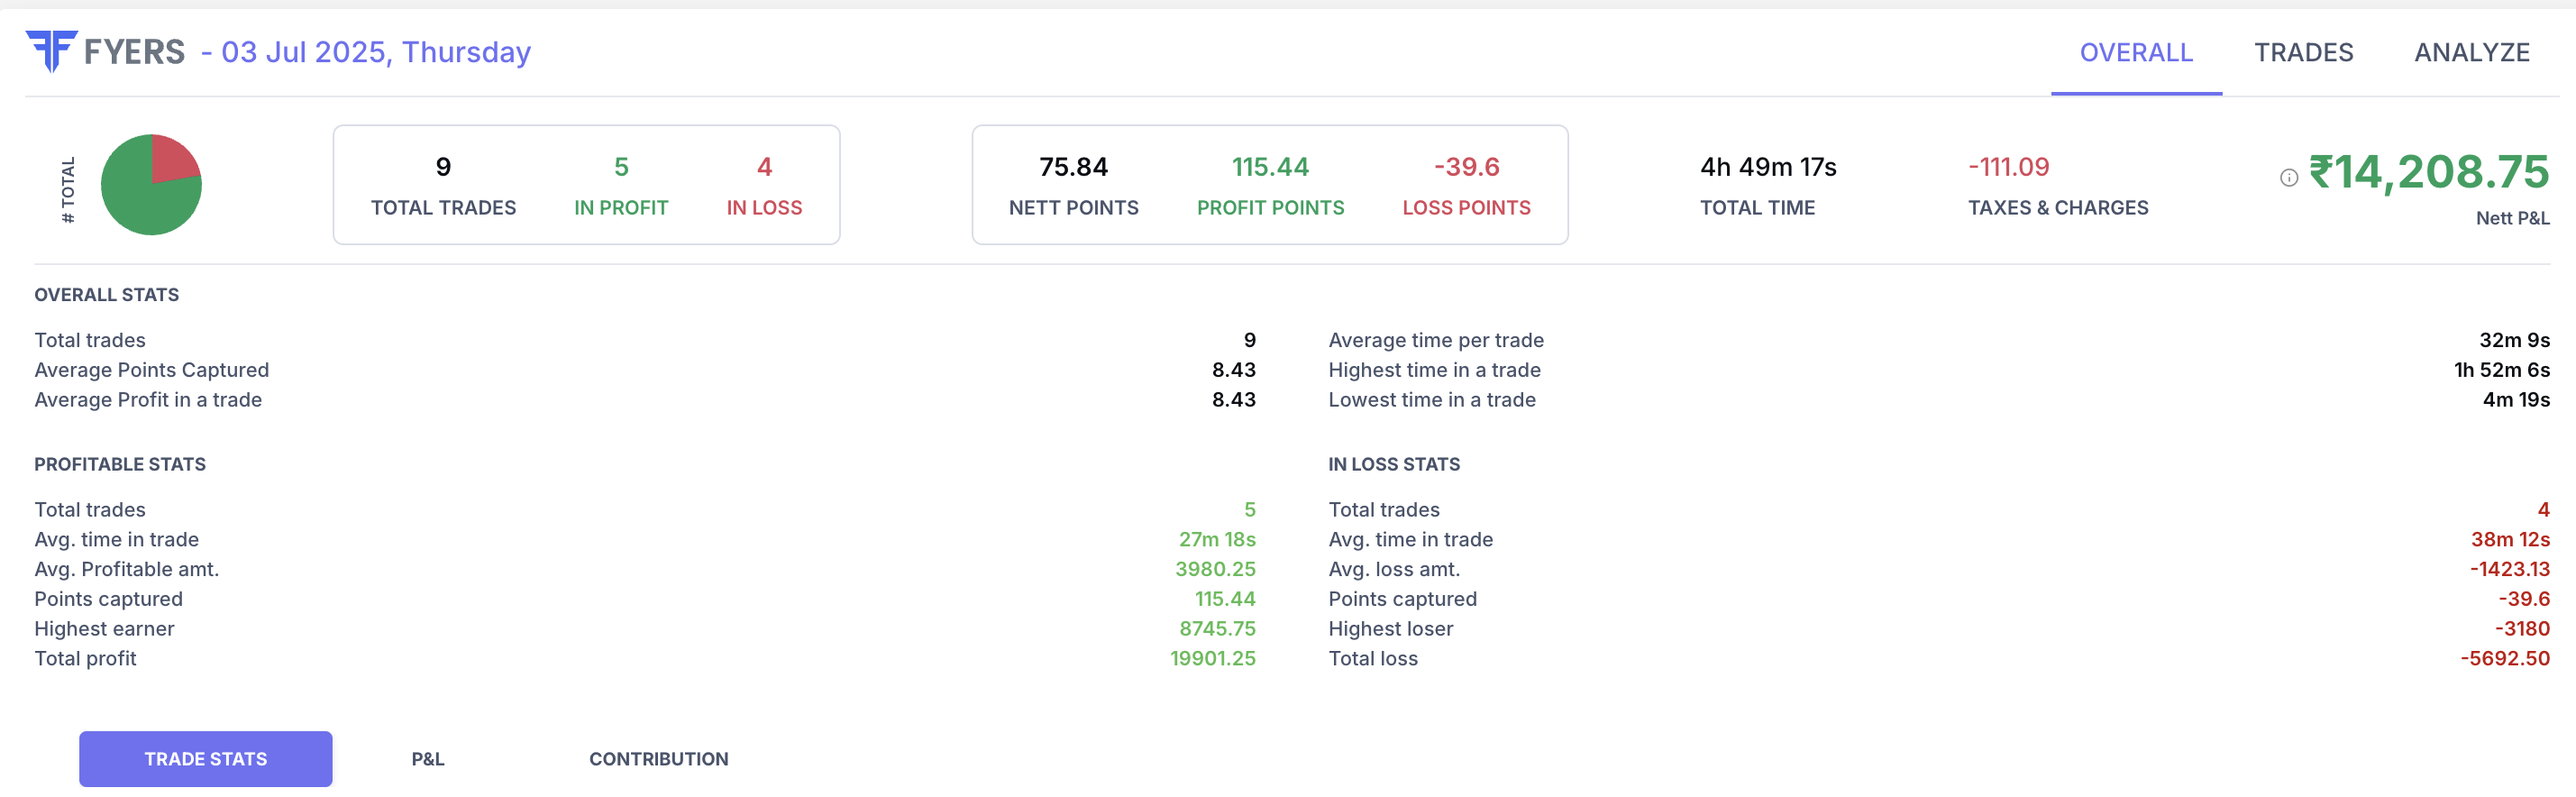
Profitable Stats
Look into this section to know characteristics of trades that fetched you profits based on the day selected.
Metrics shown here includes - total profitable trades, average time in trade which were profitable, average profit amount, highest earner, total profit and so on.
In Loss Stats
Look into this section to know characteristics of trades that fetched you losses based on the day selected.
Metrics shown here includes - total loss making trades, average time in trade which made loss, average loss amount, highest loss making trade, total loss booked and so on.
Graphical View - Overall
This is the section meant for those traders who read data well when presented in a pictorial format. This section paints the overall picture of your trade performance w.r.t stats, Profit & Loss and Contribution of each trade towards your MTM. Let’s dive deep.
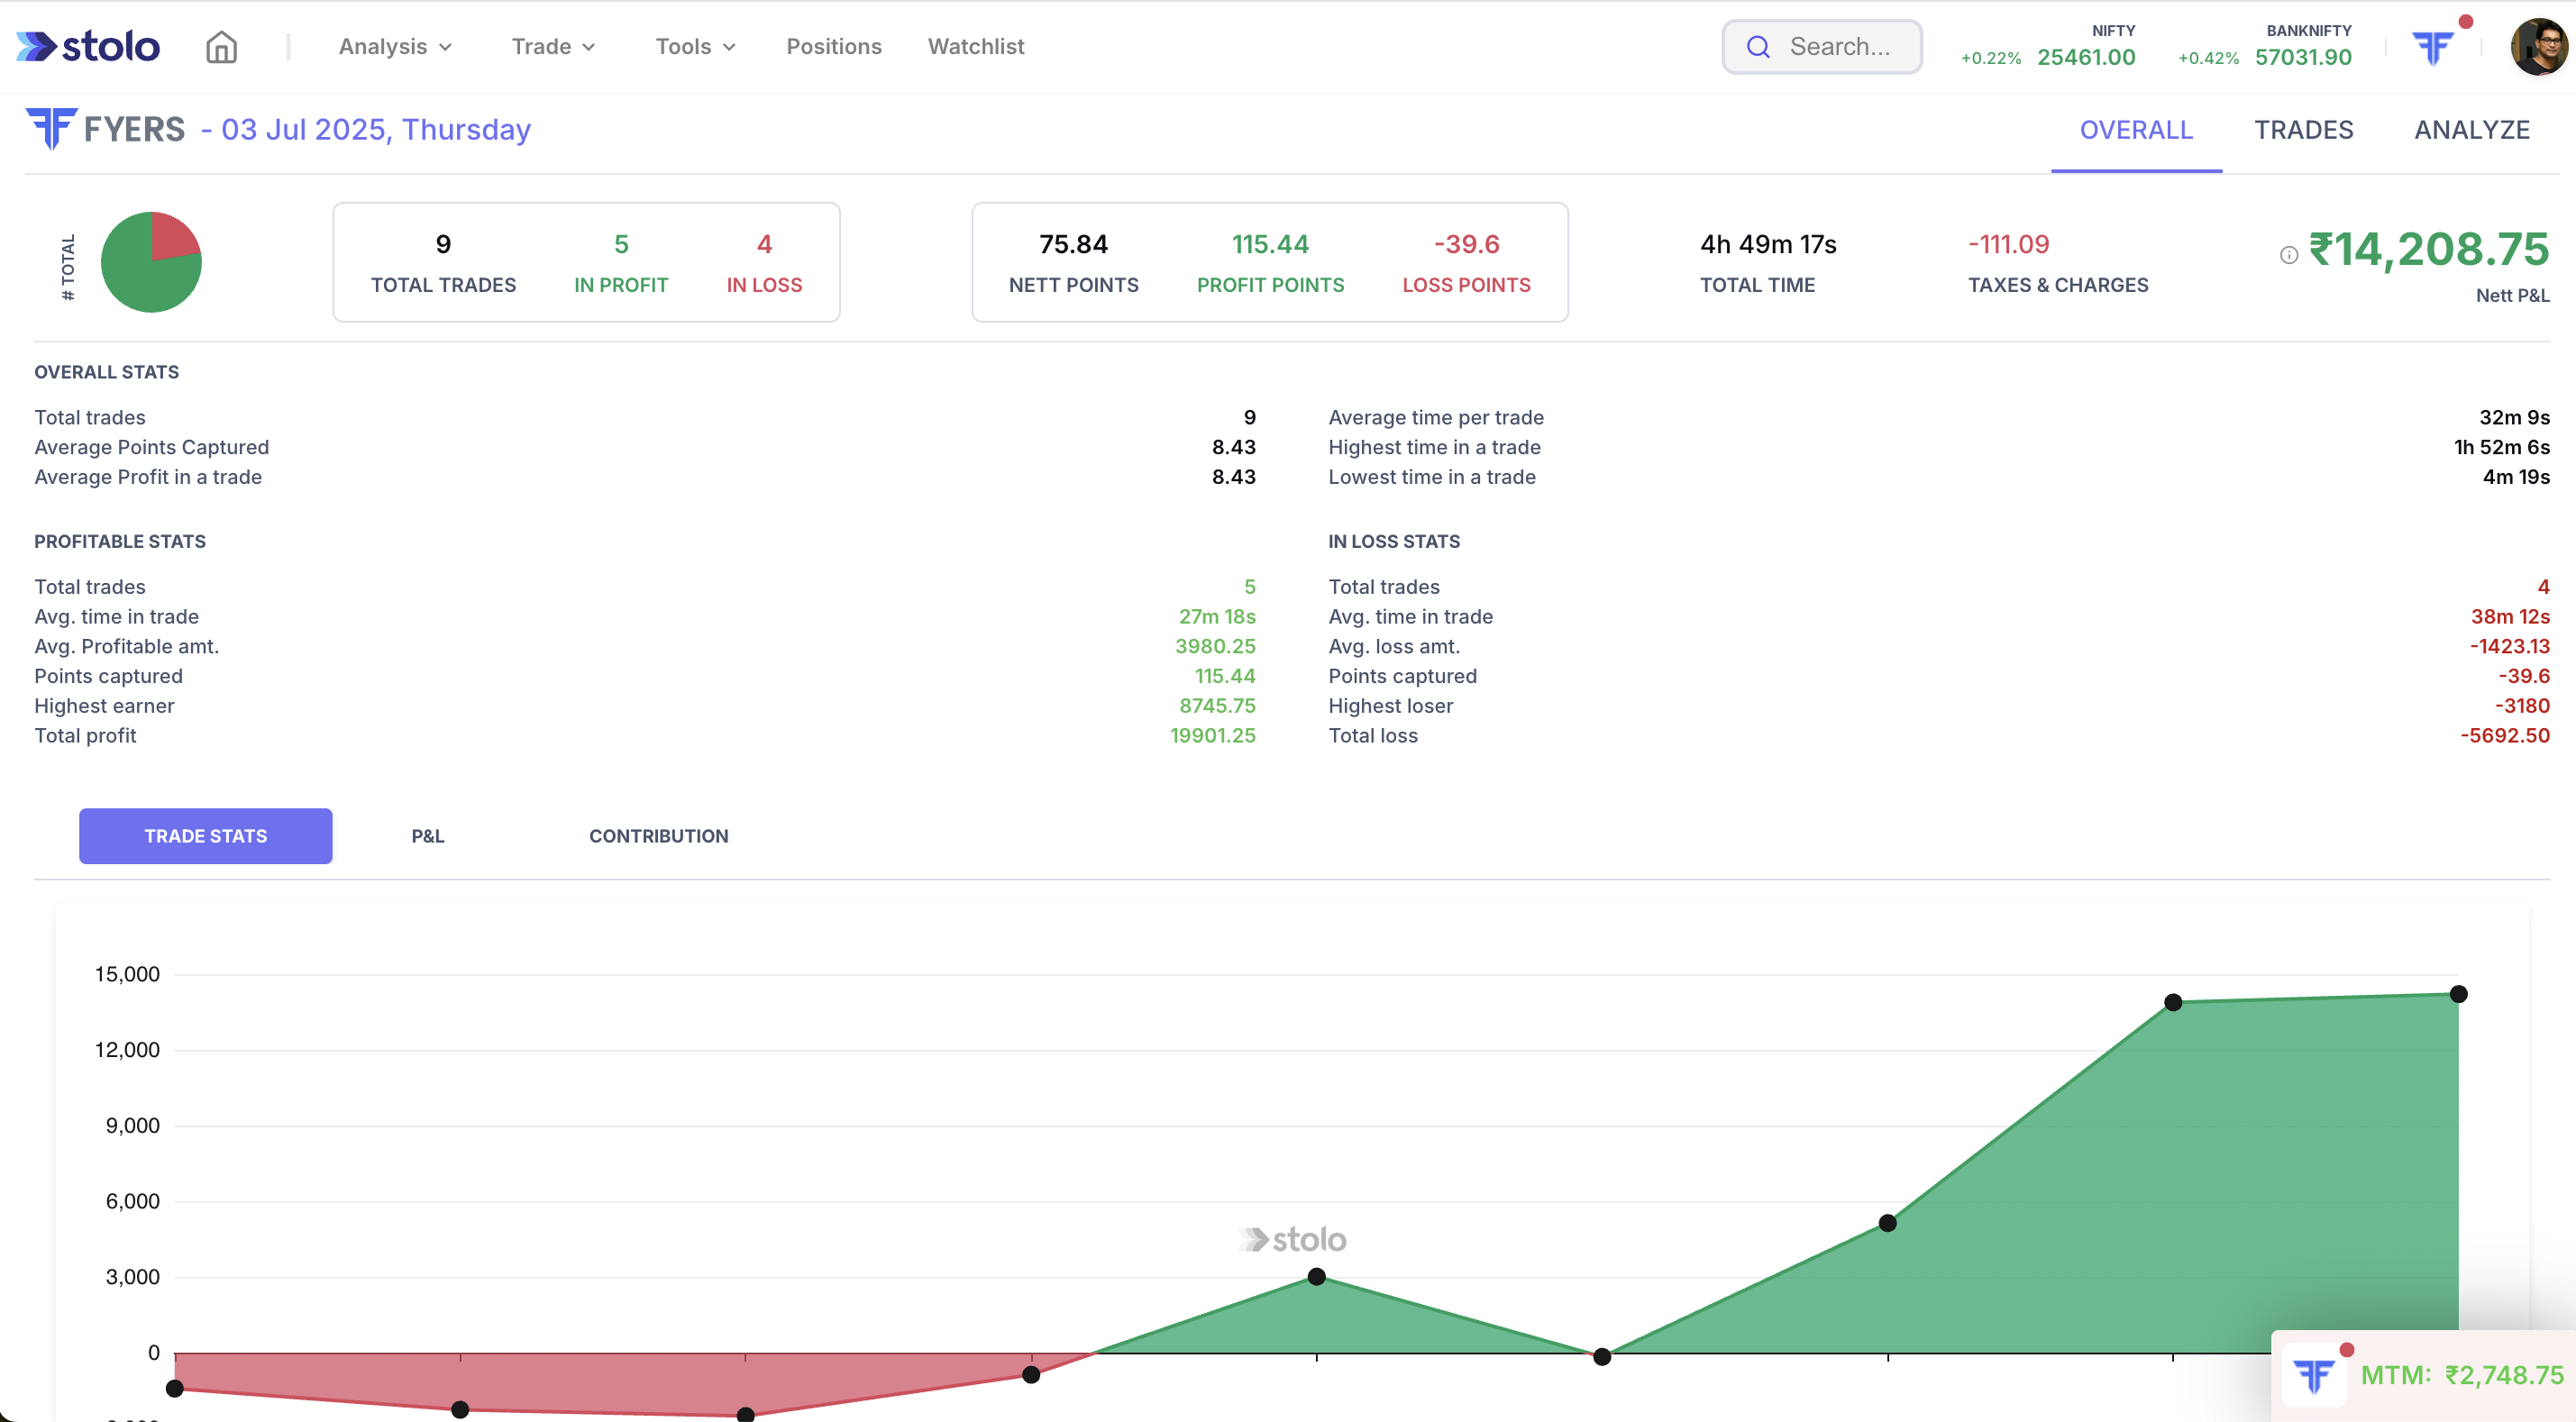
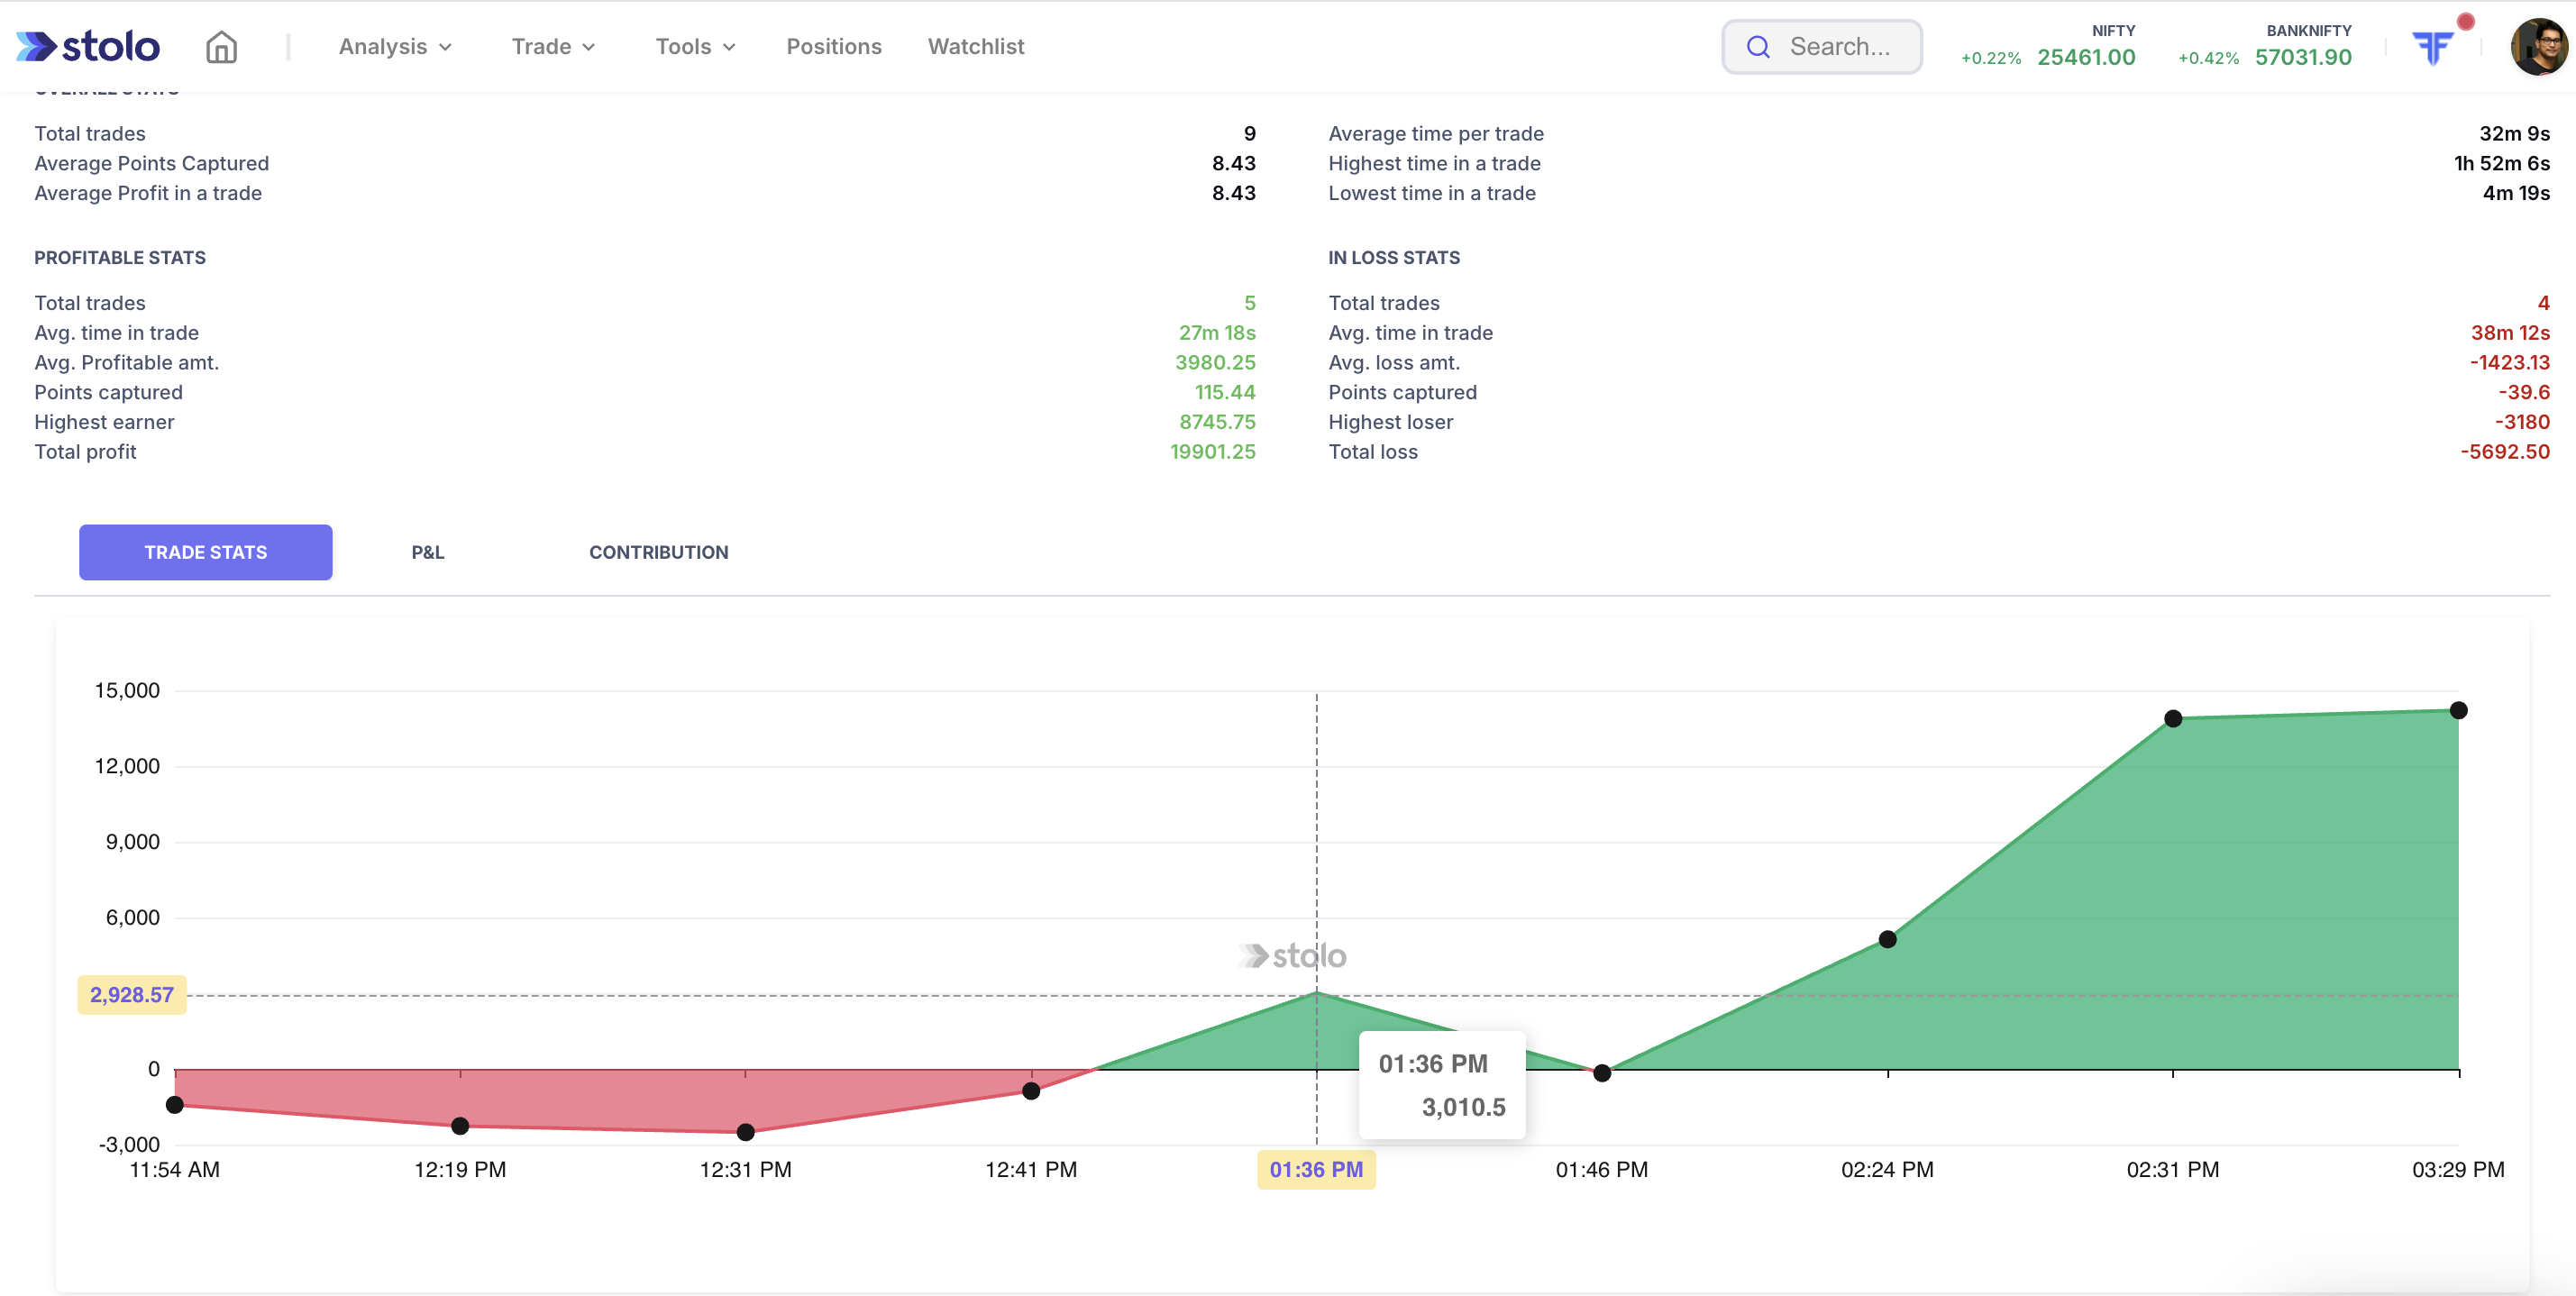
Trade Stats
Shows profit/loss made plotted against your booked orders across timestamps. This graph gives you a snapshot of your trade journey throughout the day.
P&L
This graph is meant to show the profit and loss journey for each trade taken across the day as bar graph.
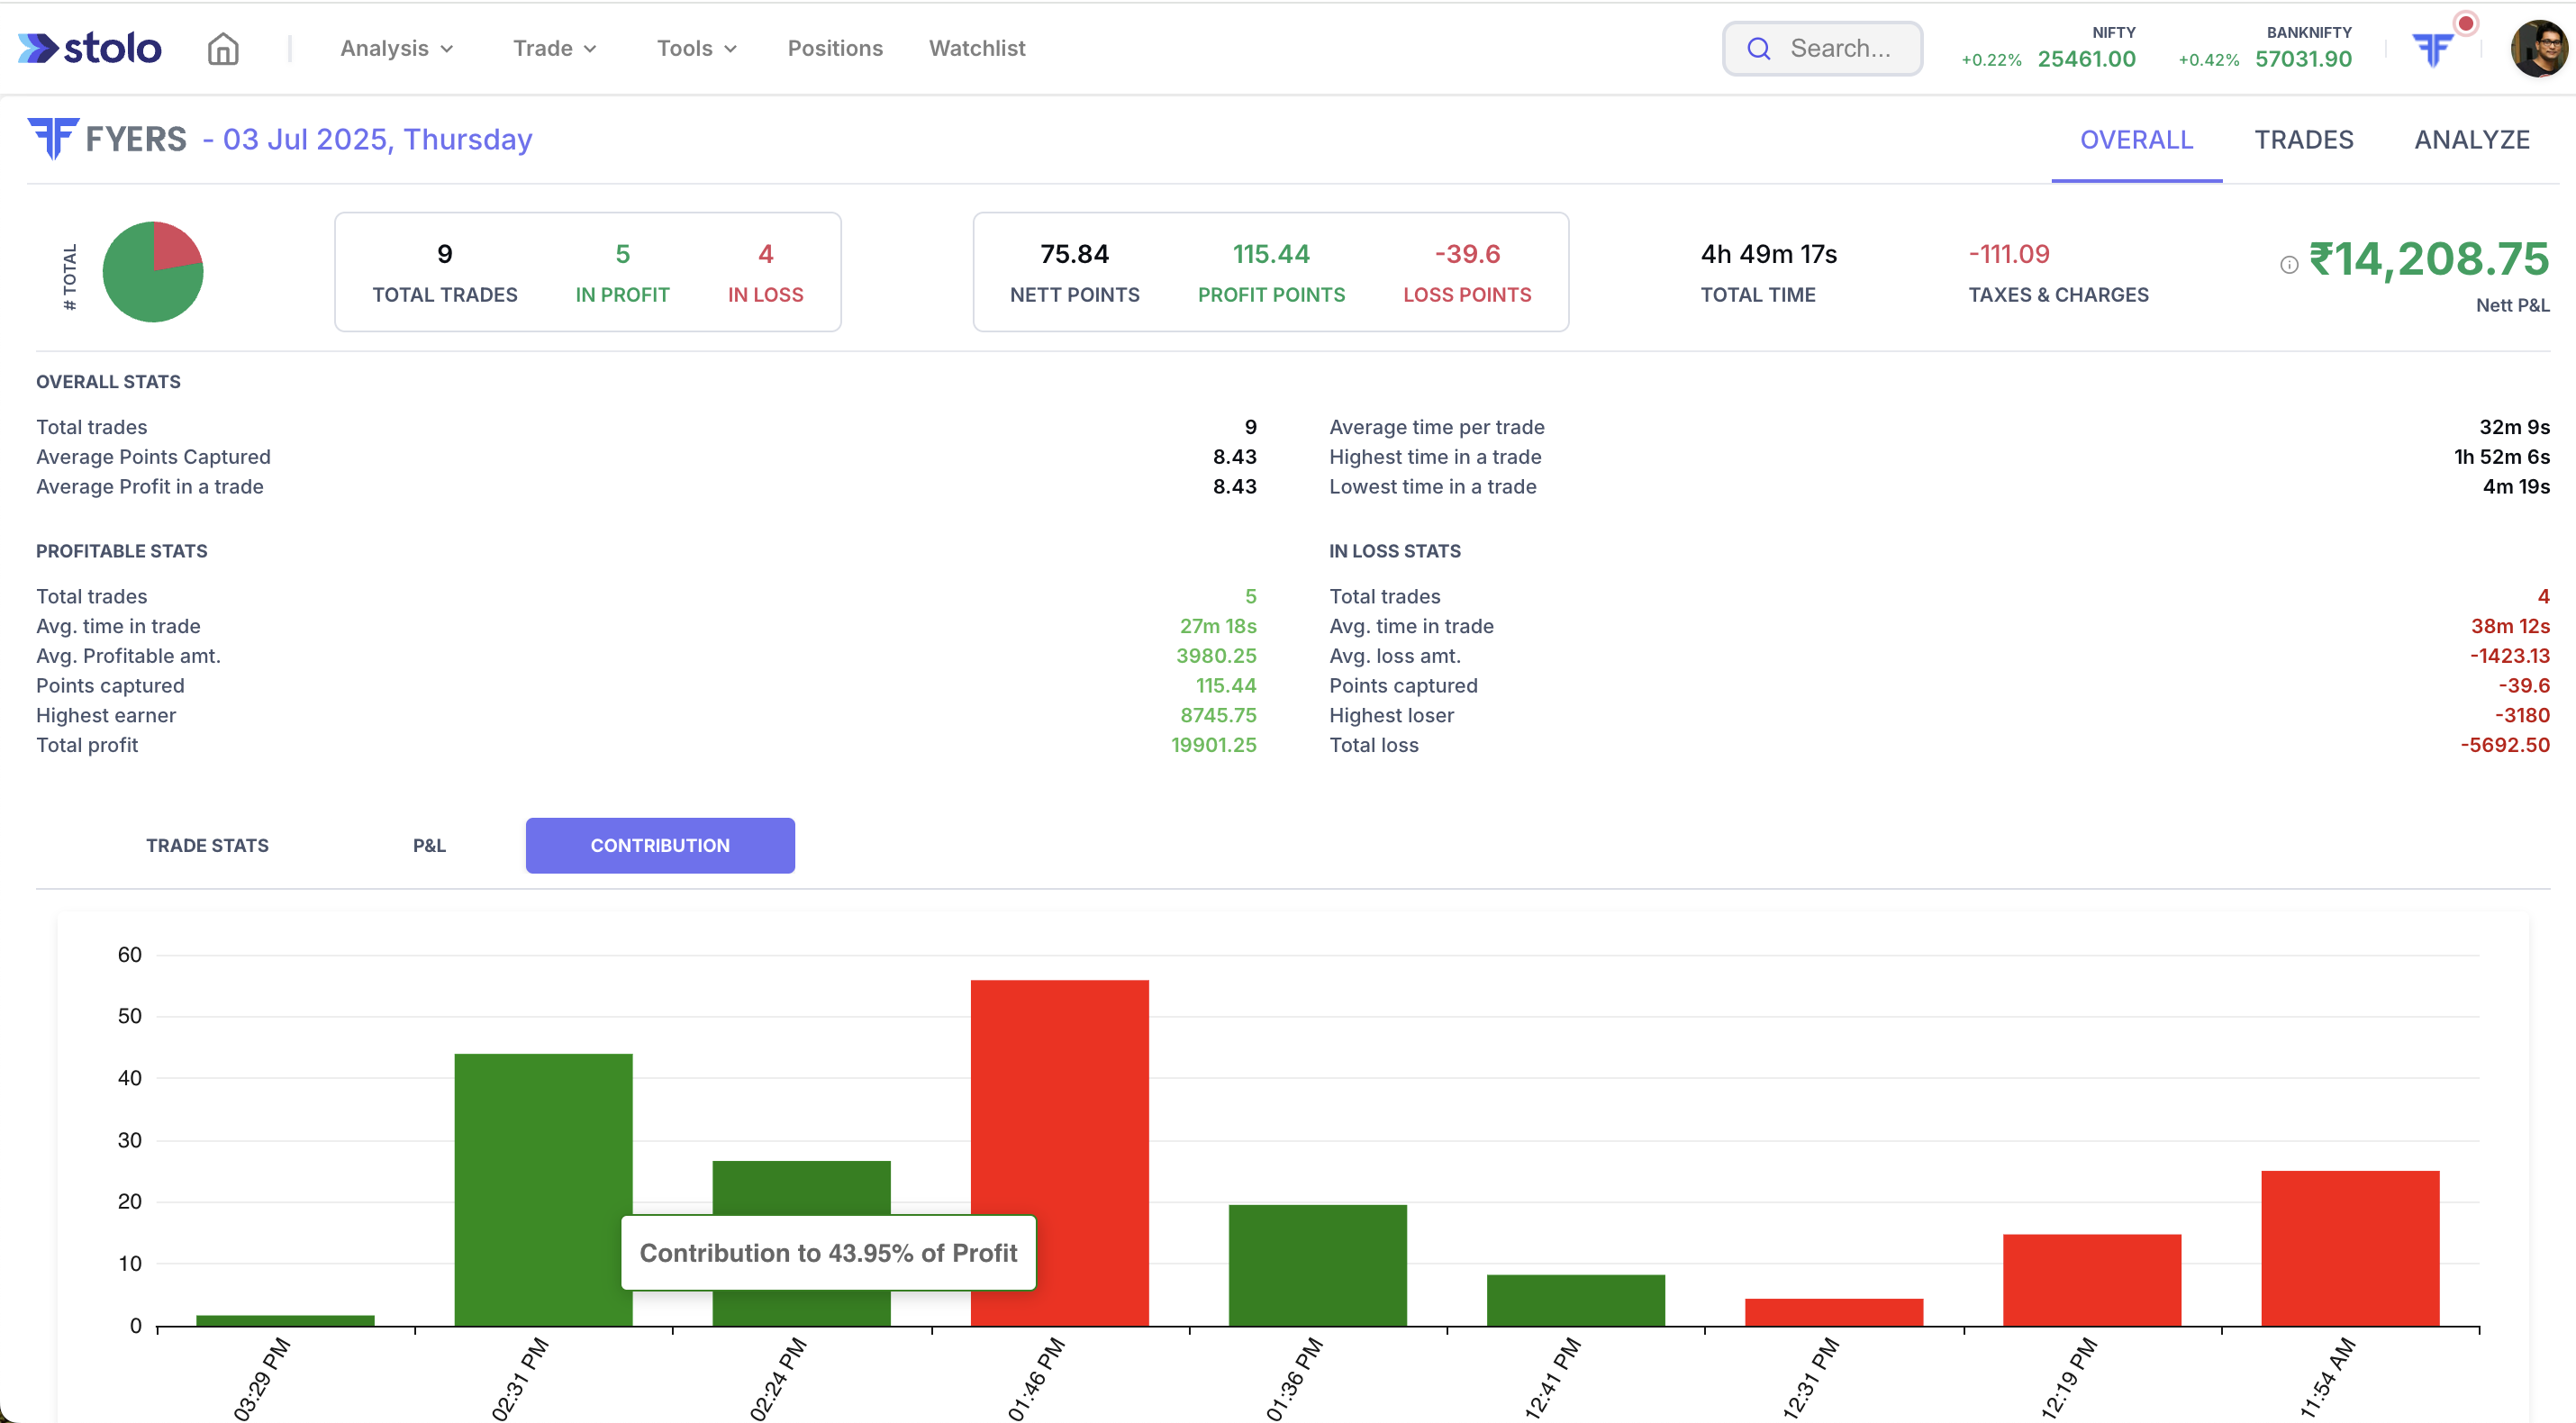
Contribution
Shows how much % each trade contributed to your overall MTM